Fiber Network
Nationwide Fiber Market Prioritization
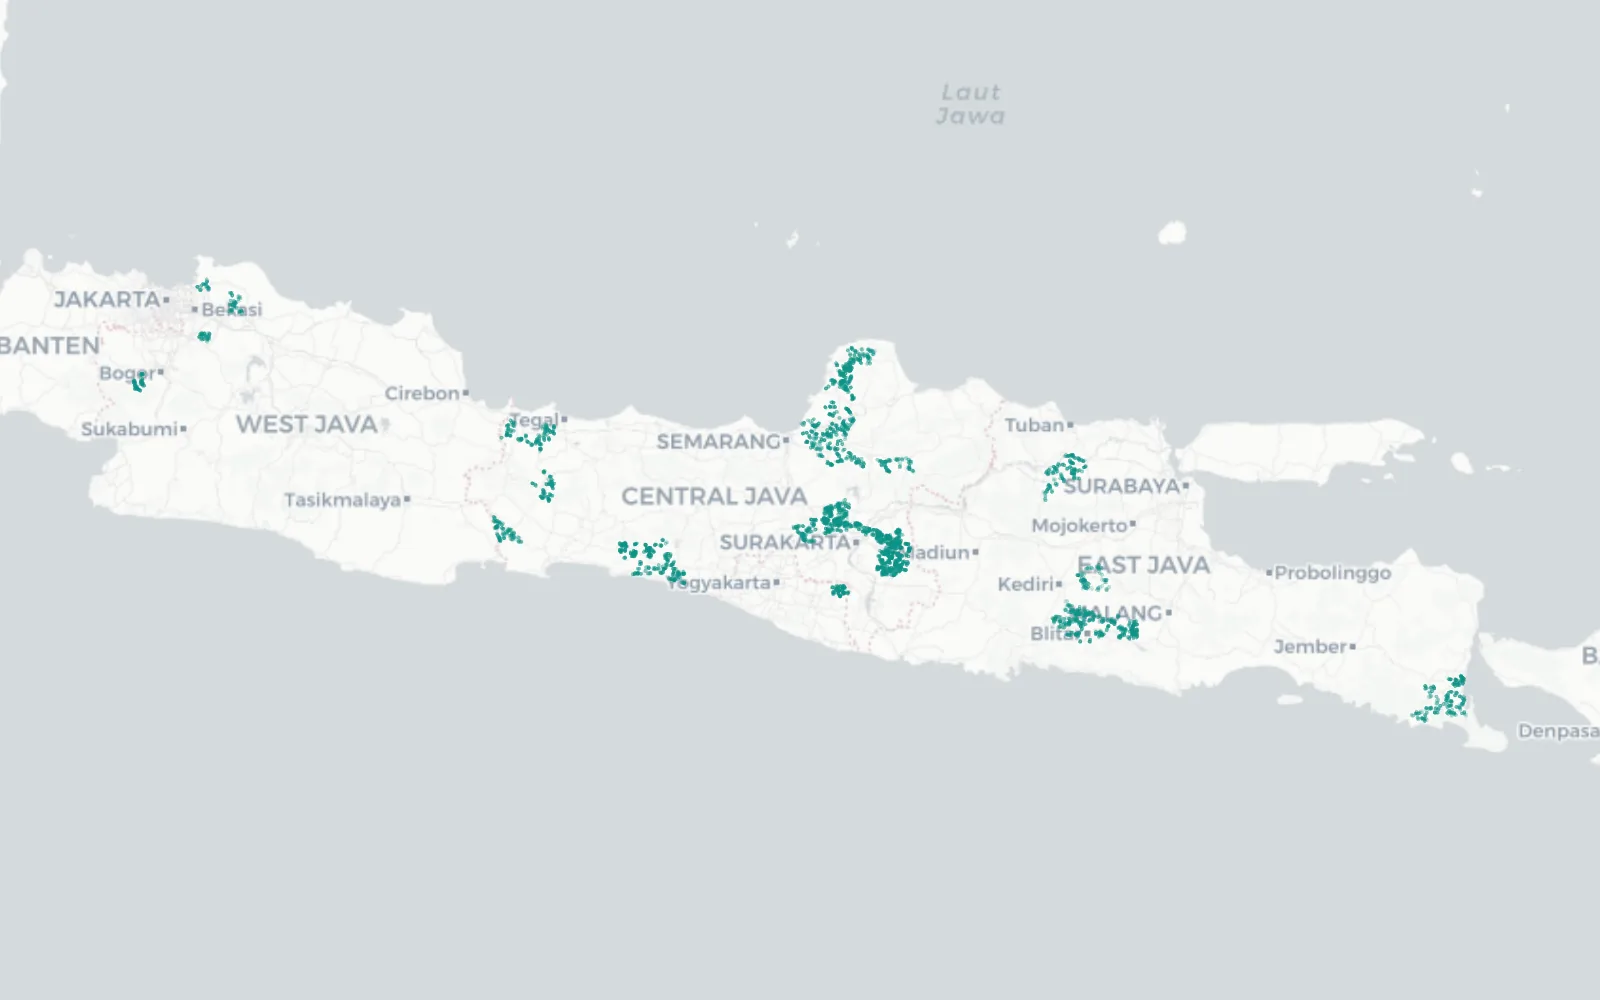
A market prioritization model that scored expansion potential from building density, road access, population patterns, and administrative boundaries, then automated the Household qualification step that used to require manual GIS review market by market.
Informed investment decisions for a fiber rollout of a million households across 400+ cities, replacing a multi week manual review cycle with a single automated pipeline run.
See the full case study
- The problem
- Fiber investment decisions were made market by market, with no consistent way to compare demand potential across cities, leaving capital allocation to intuition rather than evidence.
- The method
- Built a scoring funnel from building density, road access, population patterns, and administrative boundary data, then automated the Household qualification step that used to require manual GIS review per city.
- The result
- 400+ cities and districts assessed, informing a fiber rollout of a million households. What took weeks of manual assessment per market now runs through a single automated pipeline.
Wireless Access
Wireless Site Feasibility Screening
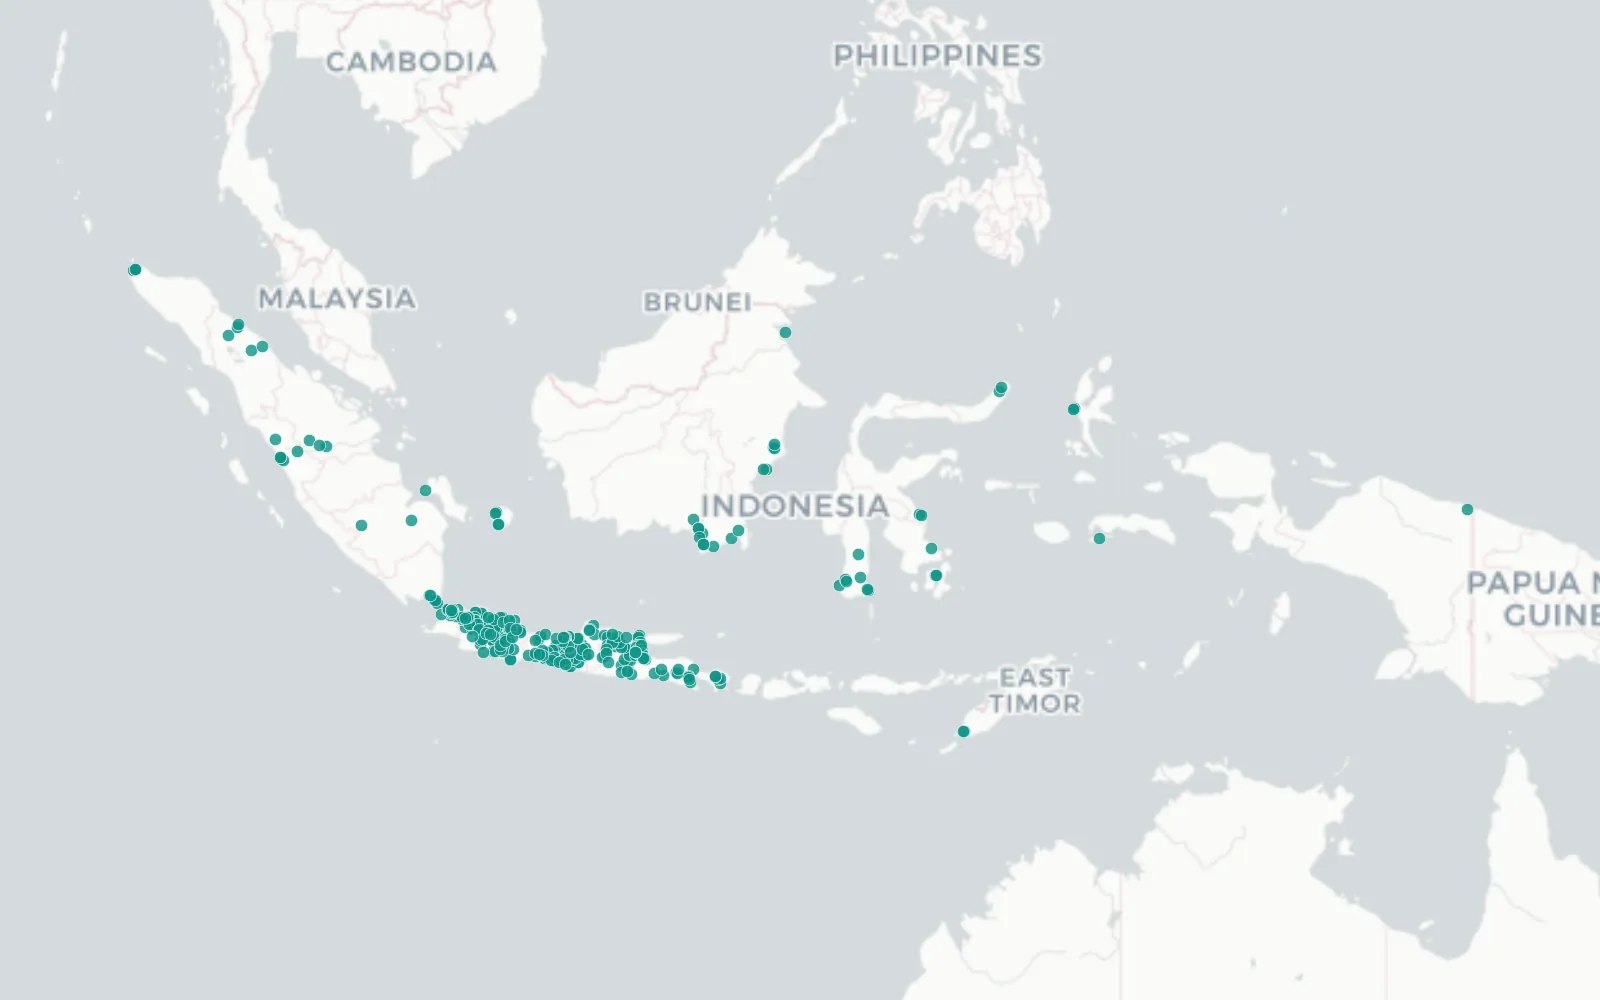
A rapid site evaluation capability that systematically assessed wireless deployment feasibility across a 13,000+ site master list spanning 14 provinces, factoring in shoreline proximity, existing infrastructure reuse, competitor presence, and capital expenditure requirements into a single repeatable scoring workflow.
Narrowed the candidate pool from 7,160 sites to 4,174 verified viable sites, replacing weeks of market by market scouting with a single data backed shortlist.
Fiber Backbone
Fiber Data Redundancy Audit
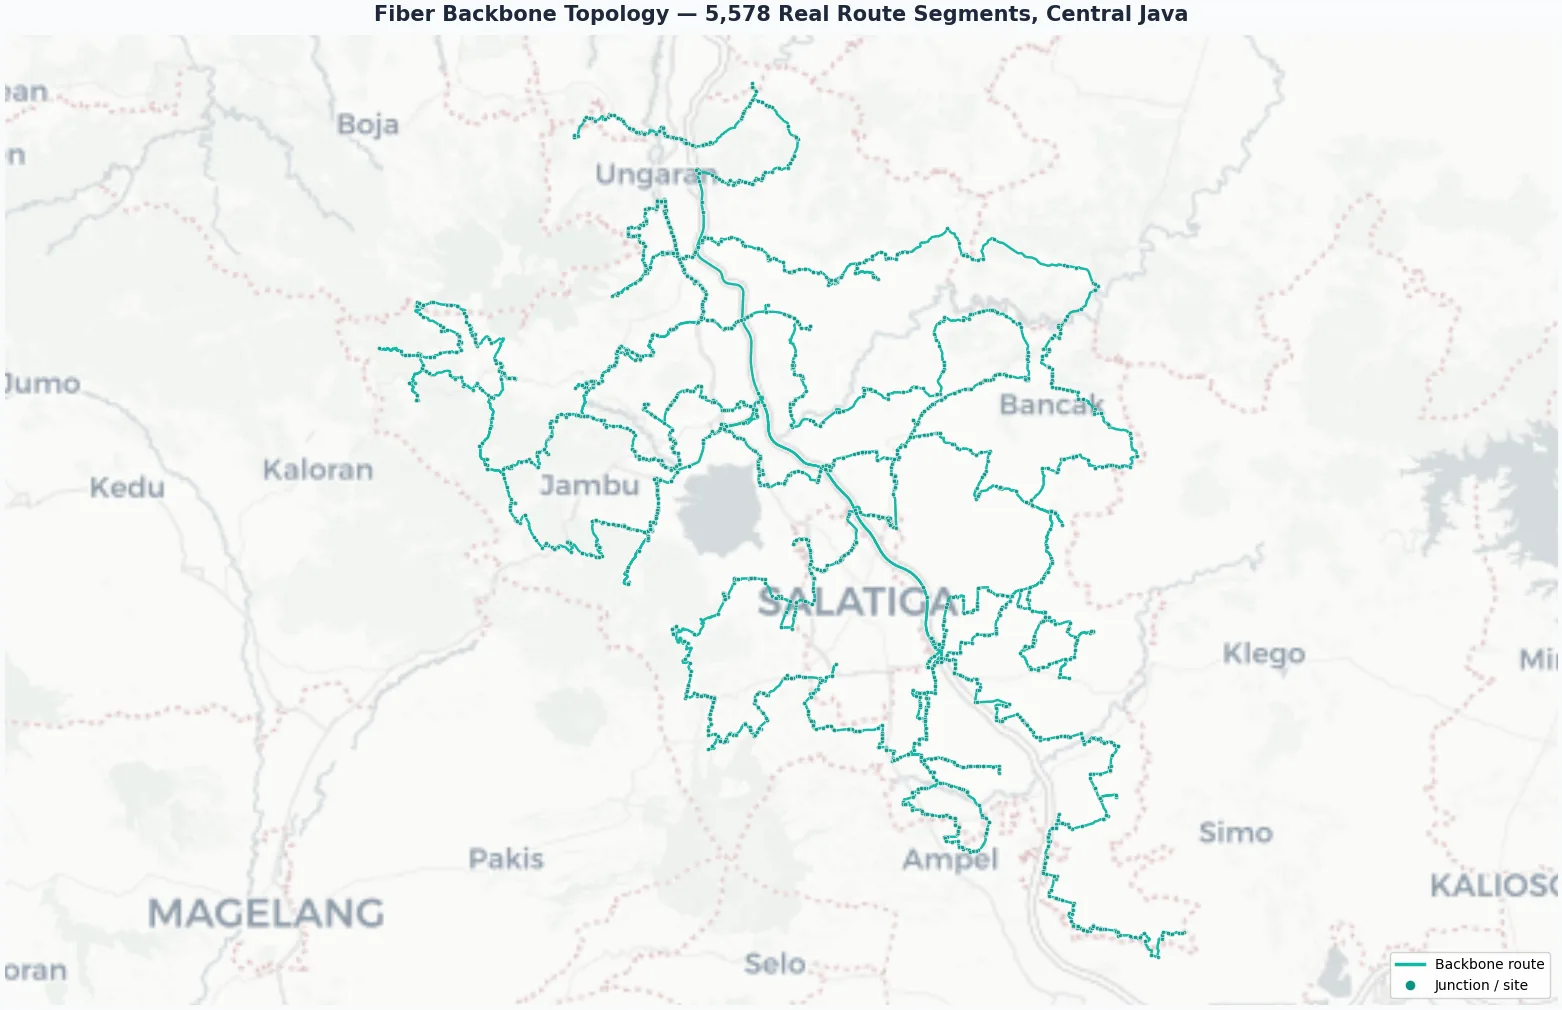
A fiber backbone audit and ring topology validation initiative that ensured network redundancy across the country's most critical metro and long haul routes, repairing incomplete network maps and screened againts the defined reliability requirements before capital was released.
Audited 5,578 backbone route segments and junctions across a Central Java corridor sample, confirming redundancy where it mattered most and flagging single point of failure risk before it reached production.
EV Infrastructure
EV Charging Location Intelligence
A market driven site selection approach for electric vehicle charging stations that scored candidate sites against 114,000+ nearby points of interest and drive time isochrones, filtering for road proximity and dealer presence before demographic fit entered the picture.
Narrowed a nationwide candidate pool to 403 final sites across 27 provinces, concentrated where dealer presence and accessibility actually converged, replacing broad area field surveys with a ranked shortlist.
Risk Screening
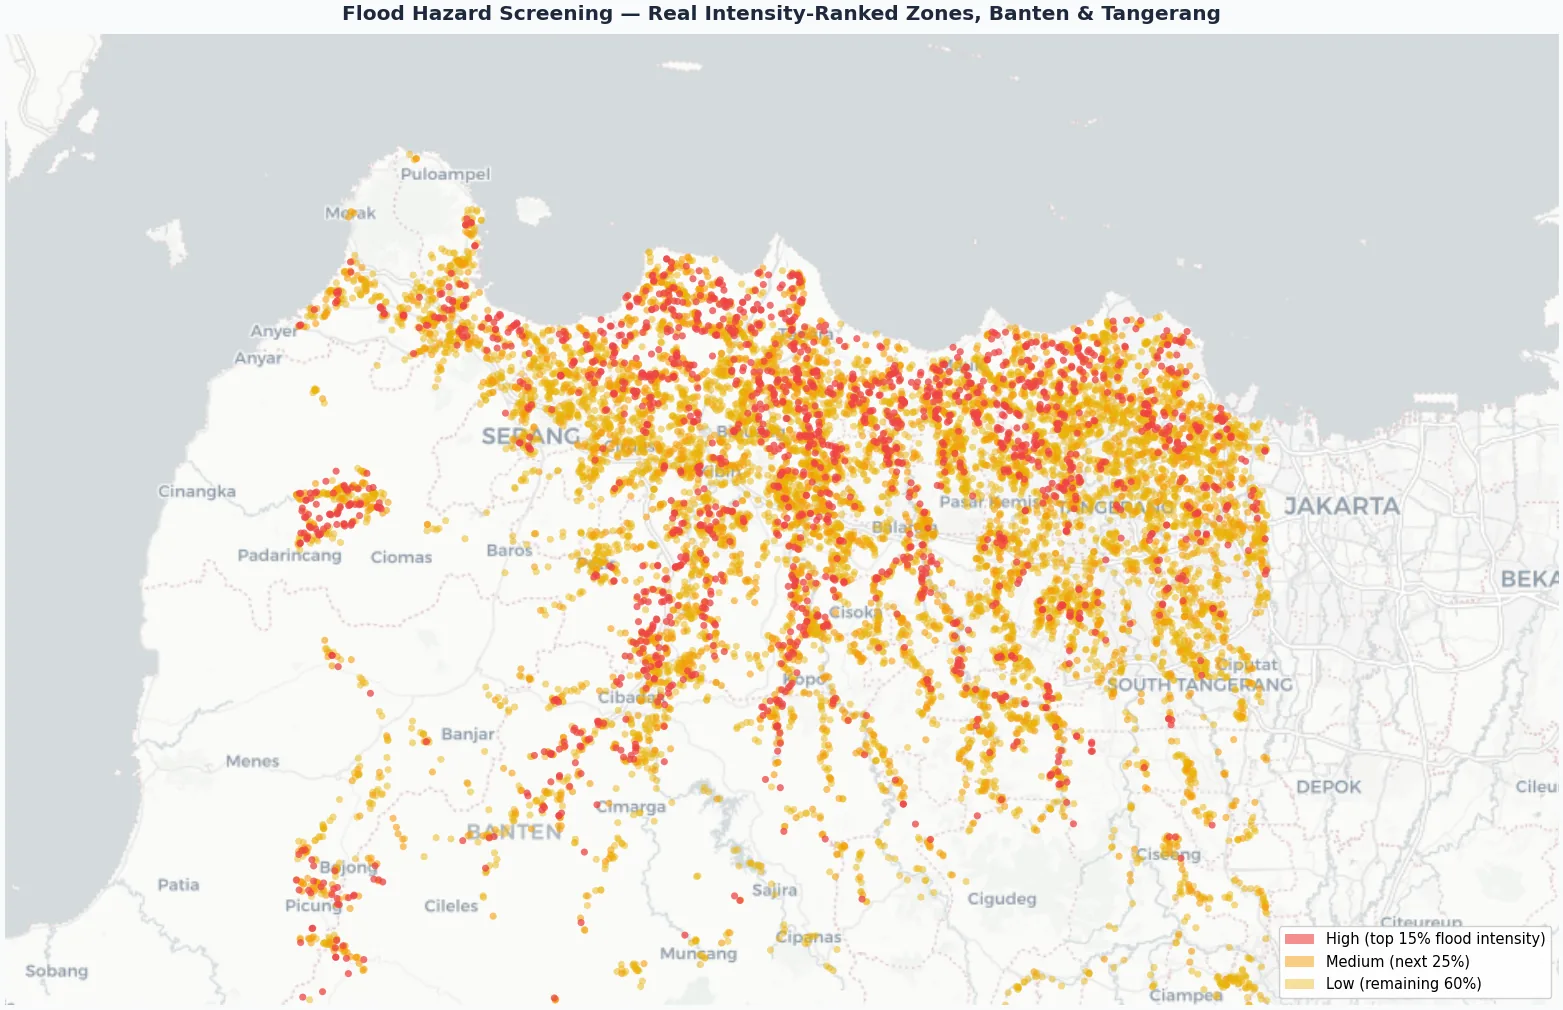
Infrastructure Hazard Risk Screening
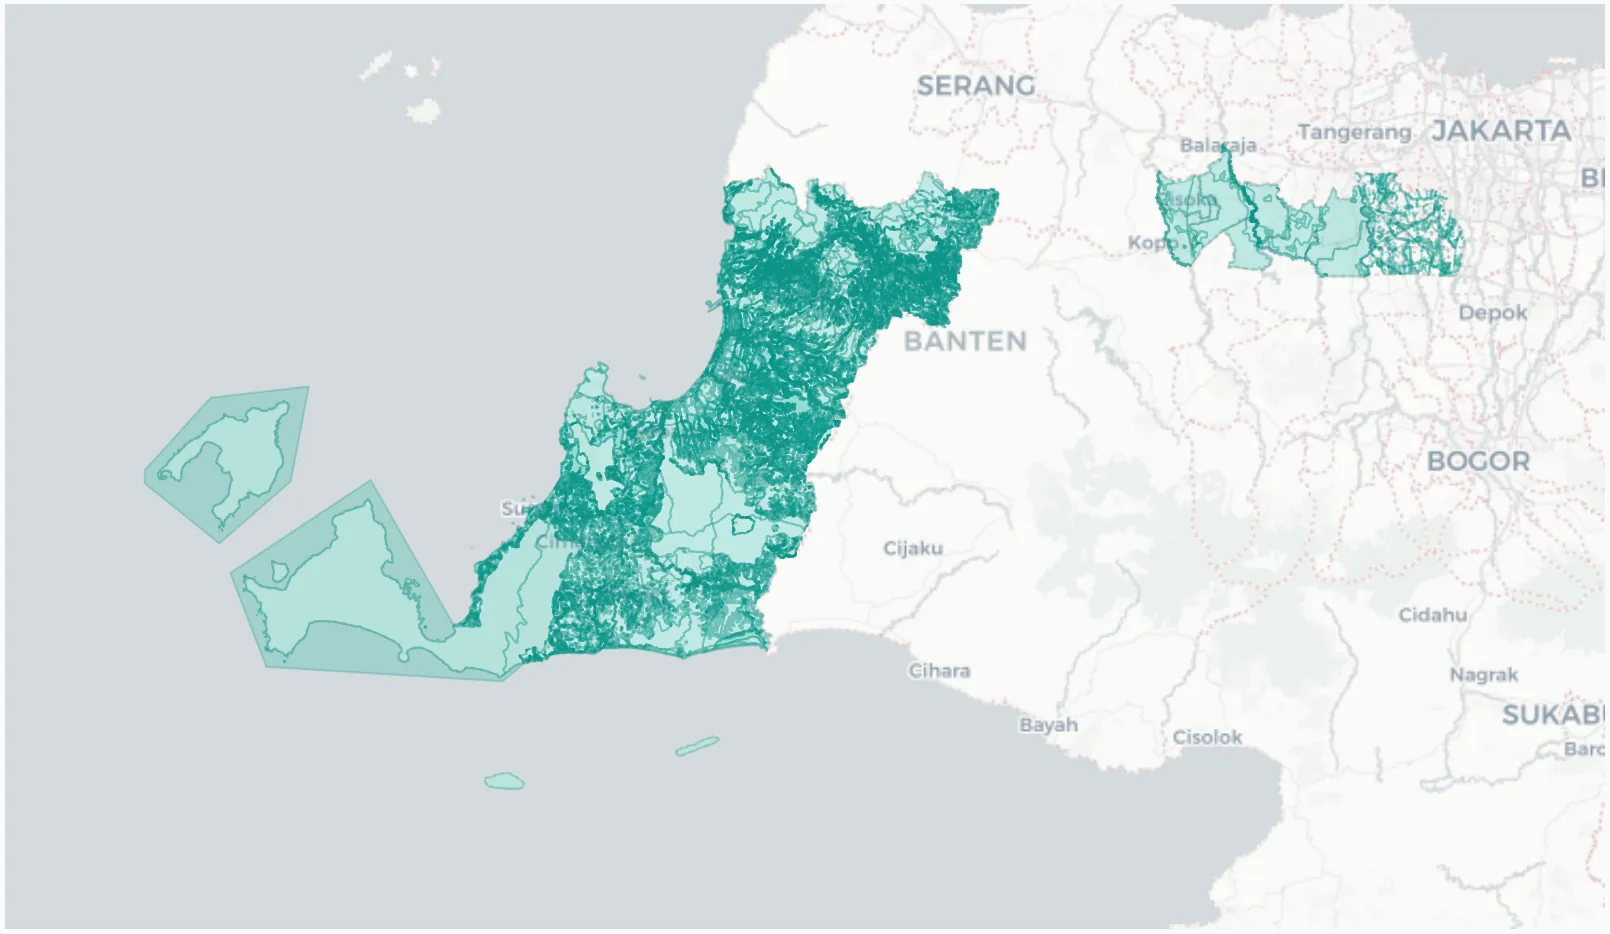
A screening process that embedded flood, earthquake, and landslide risk assessment directly into infrastructure planning workflows across Banten and Tangerang, turning disaster risk from an afterthought into a decision gate every new site had to clear.
Screened 2,614 candidate sites across Jawa Barat and Banten, flagging high hazard zones before capital was committed and protecting investment in two of the country's most disaster prone corridors.
Enterprise B2B
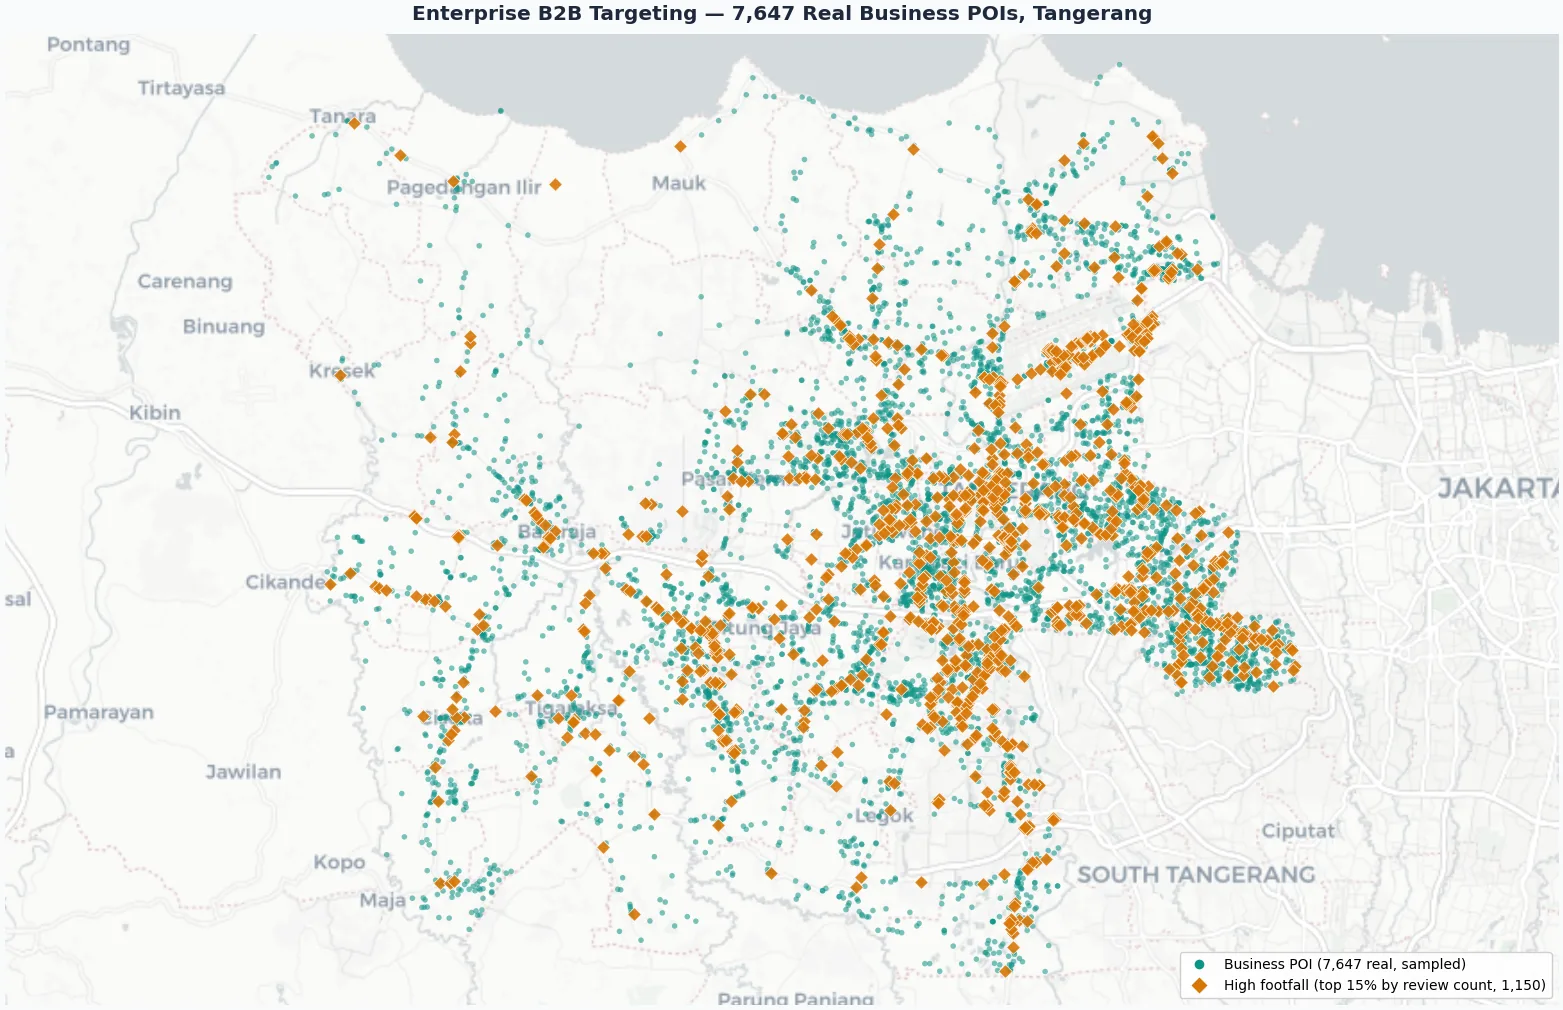
Enterprise Lead Scoring Engine
A targeted B2B qualification system that identified high value enterprise buildings by classifying schools, mapping corporate office clusters, and scoring individual buildings for fiber serviceability, enriching a database of 600,000+ business locations with intelligence that used to require manual desk research.
Scored 7,600+ business points of interest in a Tangerang footfall pilot alone, turning a static location list into a ranked pipeline that sharpened where enterprise sales spent their time.
Satellite Infrastructure
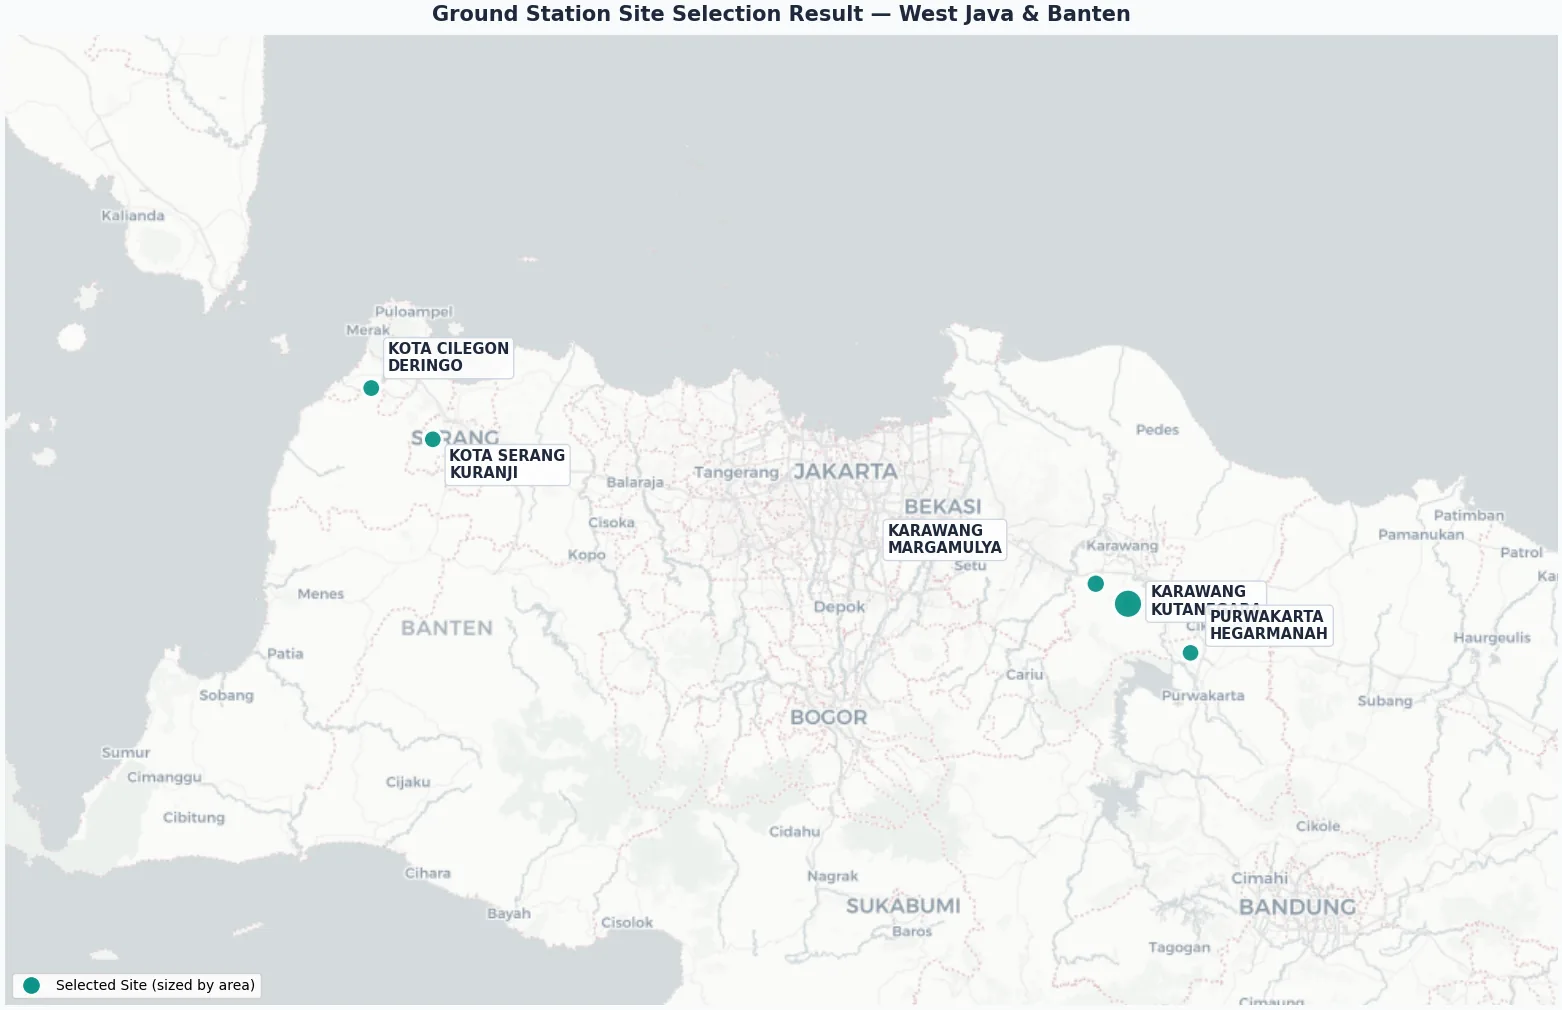
Ground Station Sites
A location planning exercise that weighed signal coverage requirements against real world construction constraints, layering flood, earthquake, and landslide hazard buffers with terrain and road access screens over every candidate parcel.
Delivered 5 verified ground station sites across West Java and Banten, each cleared against every hazard and access constraint before acquisition, cutting the risk of costly surprises partway through construction.
See the full case study
- The problem
- A ground station site had to satisfy signal coverage requirements from two Jakarta data centers while clearing flood, earthquake, and landslide hazard buffers, minimum distances from airports, schools, and places of worship, and realistic road access, which added up to a lot of hard constraints to reconcile by hand.
- The method
- Layered hazard rasters (flood, earthquake, landslide) and proximity exclusion buffers over the candidate area, then scored the surviving parcels for construction access and line of sight coverage.
- The result
- 5 sites selected across Kota Cilegon, Kota Serang, Karawang (two sites), and Purwakarta, each verified against constraints before acquisition.
Location Intelligence
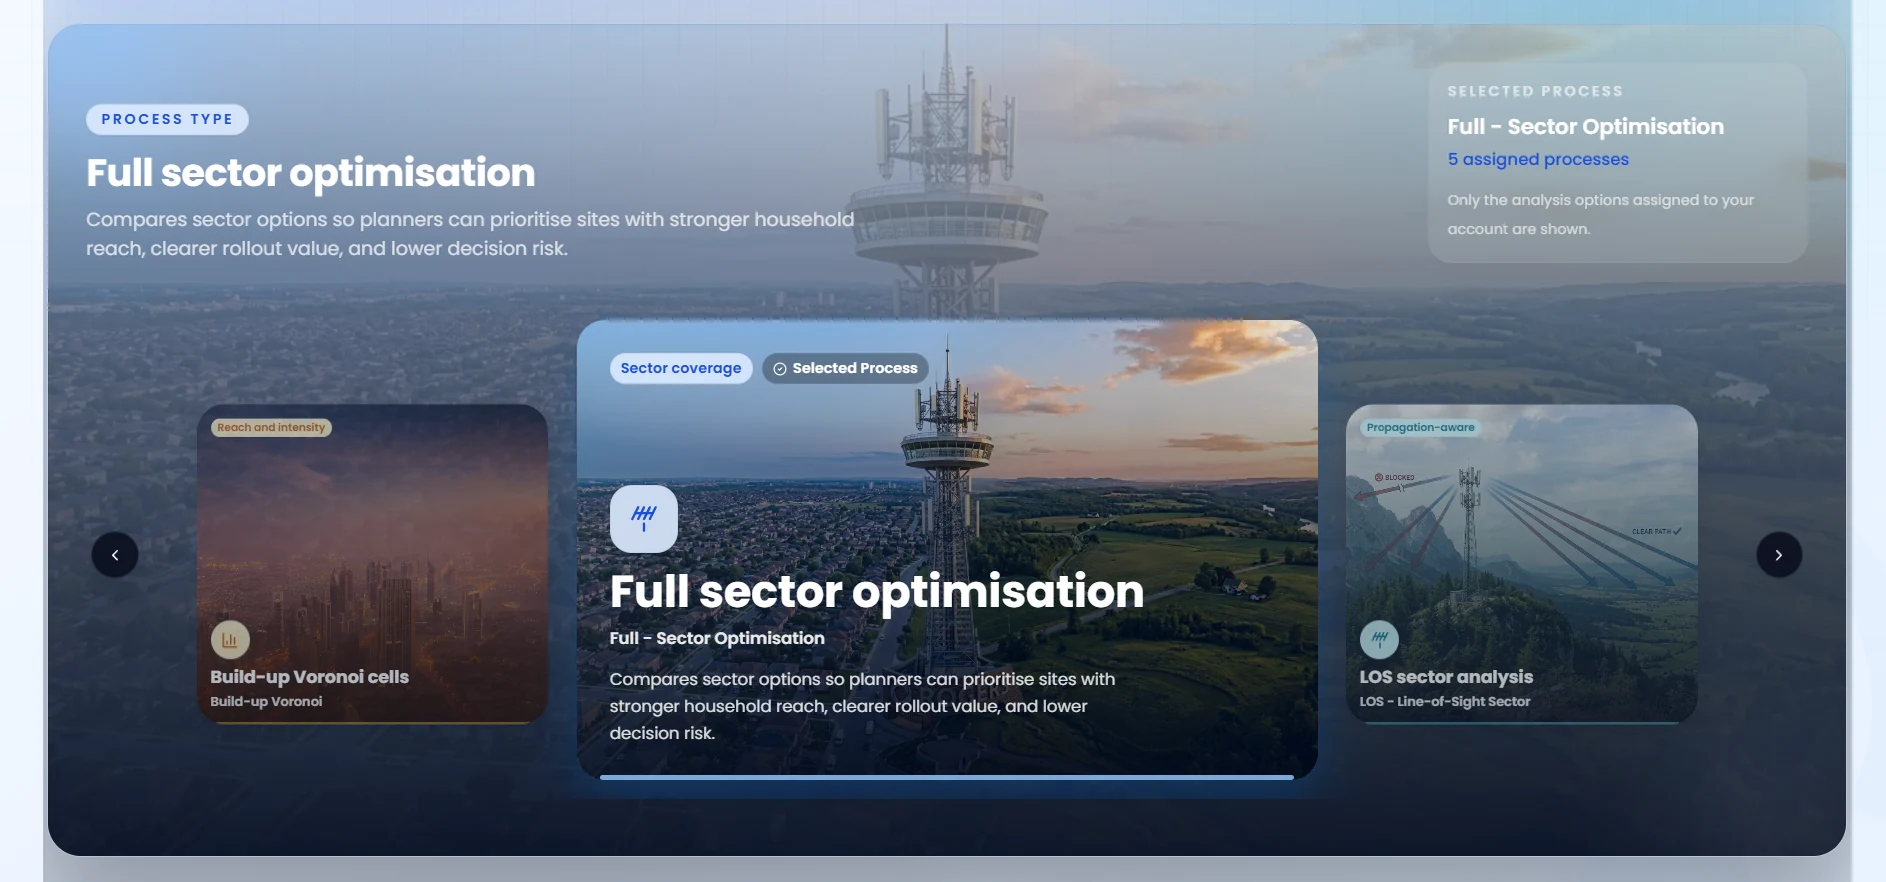
Coverage Intelligence Platform
An internal decision support platform that gave planning teams a self service workspace for sector optimization, line of sight analysis, Voronoi coverage cells, and build up buffer scenarios, covering five assigned analysis processes end to end. Teams upload a site list and get back sector options ranked by household reach potential and rollout value.
Compressed sector planning turnaround from days of back and forth with a specialist to an on demand run any planner could use, replacing a request queue with a shared, always available view of coverage scenarios.
Urban Planning
Urban Expansion Forecaster
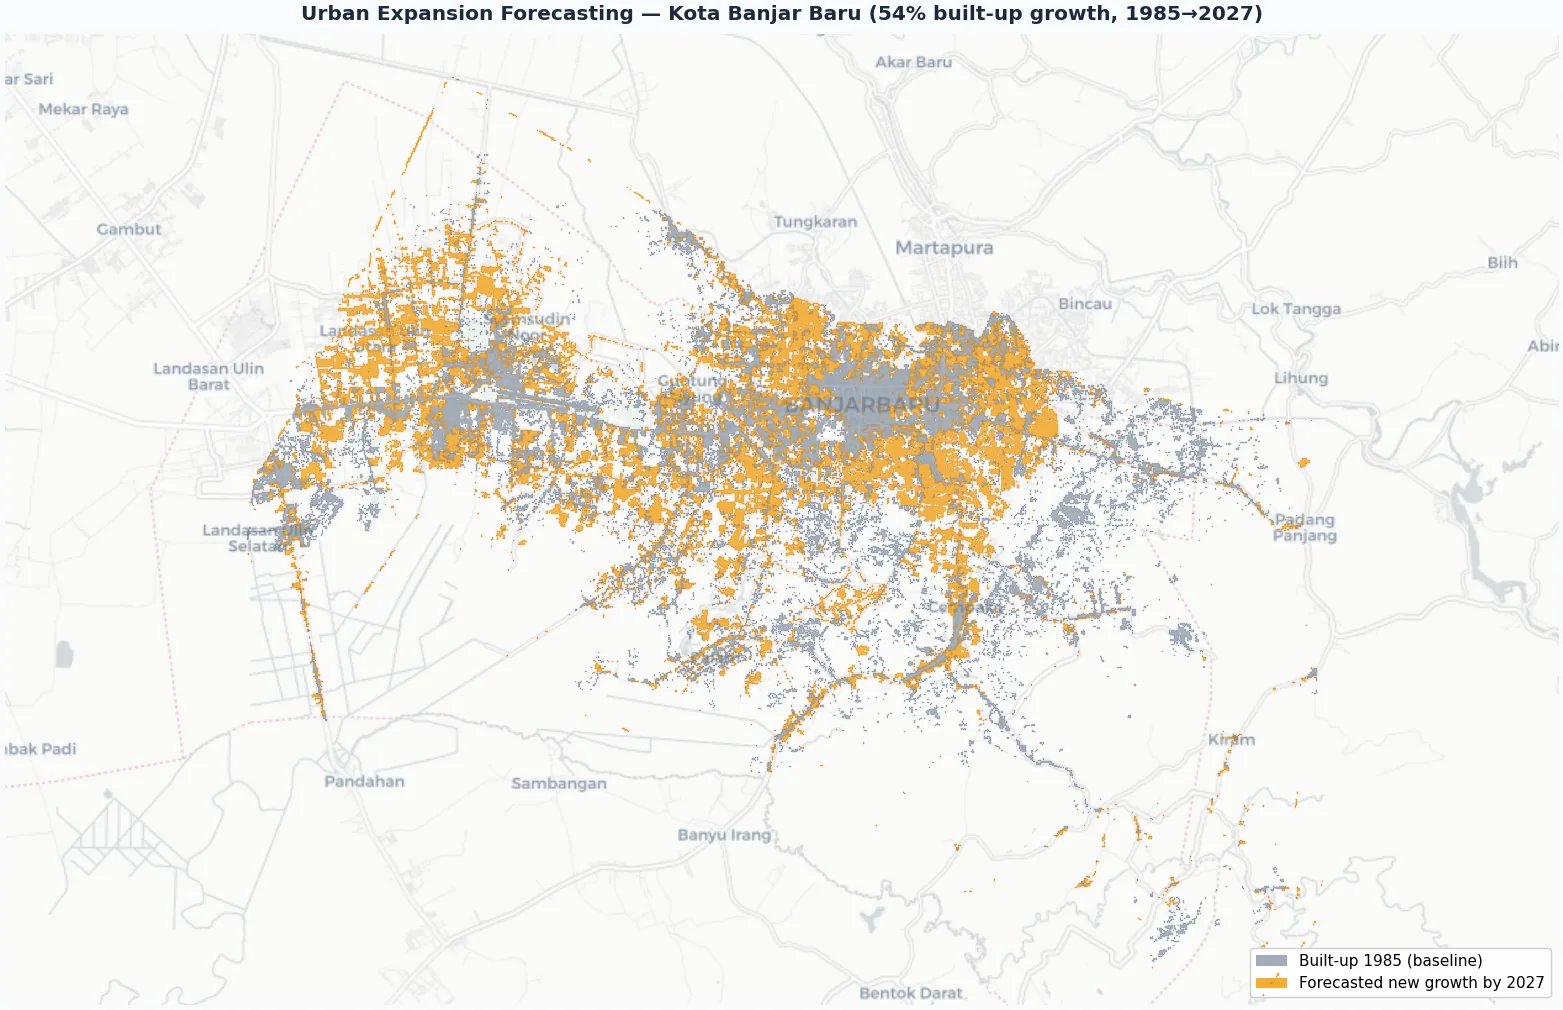
A forward looking market intelligence model that projected urban growth patterns using a four decade land cover baseline forecast out to 2027, reading built up area change directly instead of relying on population projections alone.
Forecasted 54% built up area growth in Kota Banjar Baru by 2027, helping teams identify emerging growth areas earlier in the investment planning cycle and shifting infrastructure investment timing from reactive to proactive.
Data Pipeline
Automated POI Pipeline
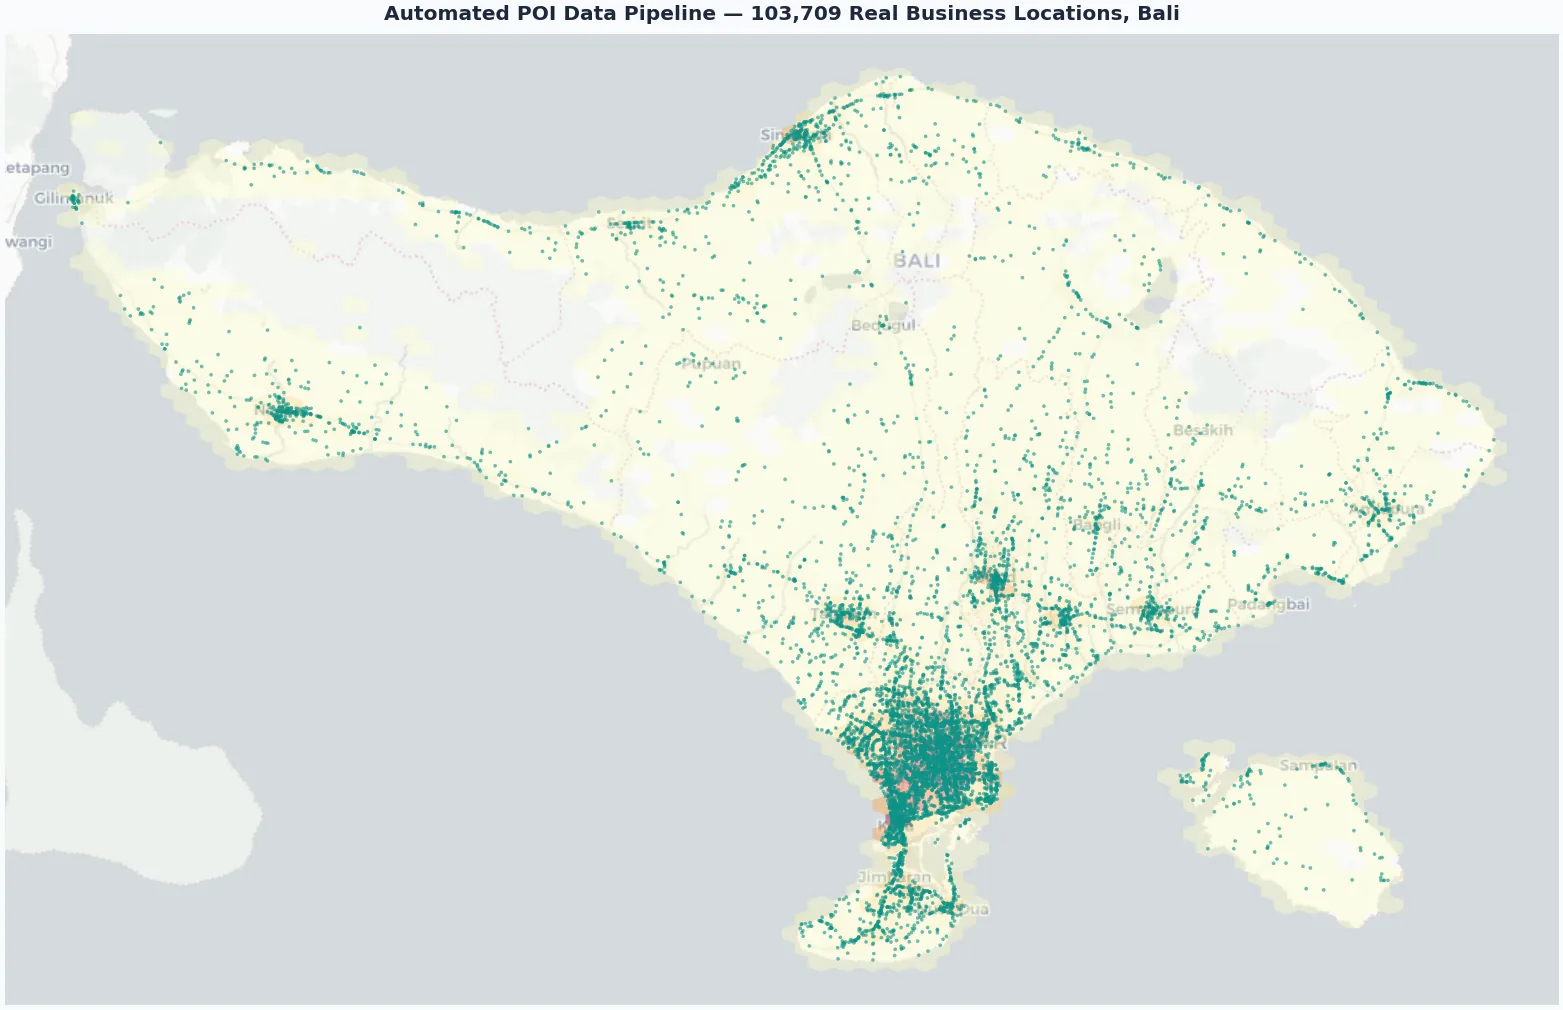
A fully automated data operation that maintained millions of business location records with quality control built in, continuous updates, and standardized formatting, deployed on cloud infrastructure for reliability at scale.
Reduced manual data processing by 80%+, keeping pipelines like a 100,000+ point Bali POI refresh current and trustworthy without manual review, strengthening data as a service revenue streams.
Fiber Design
Automated FTTH Network Design
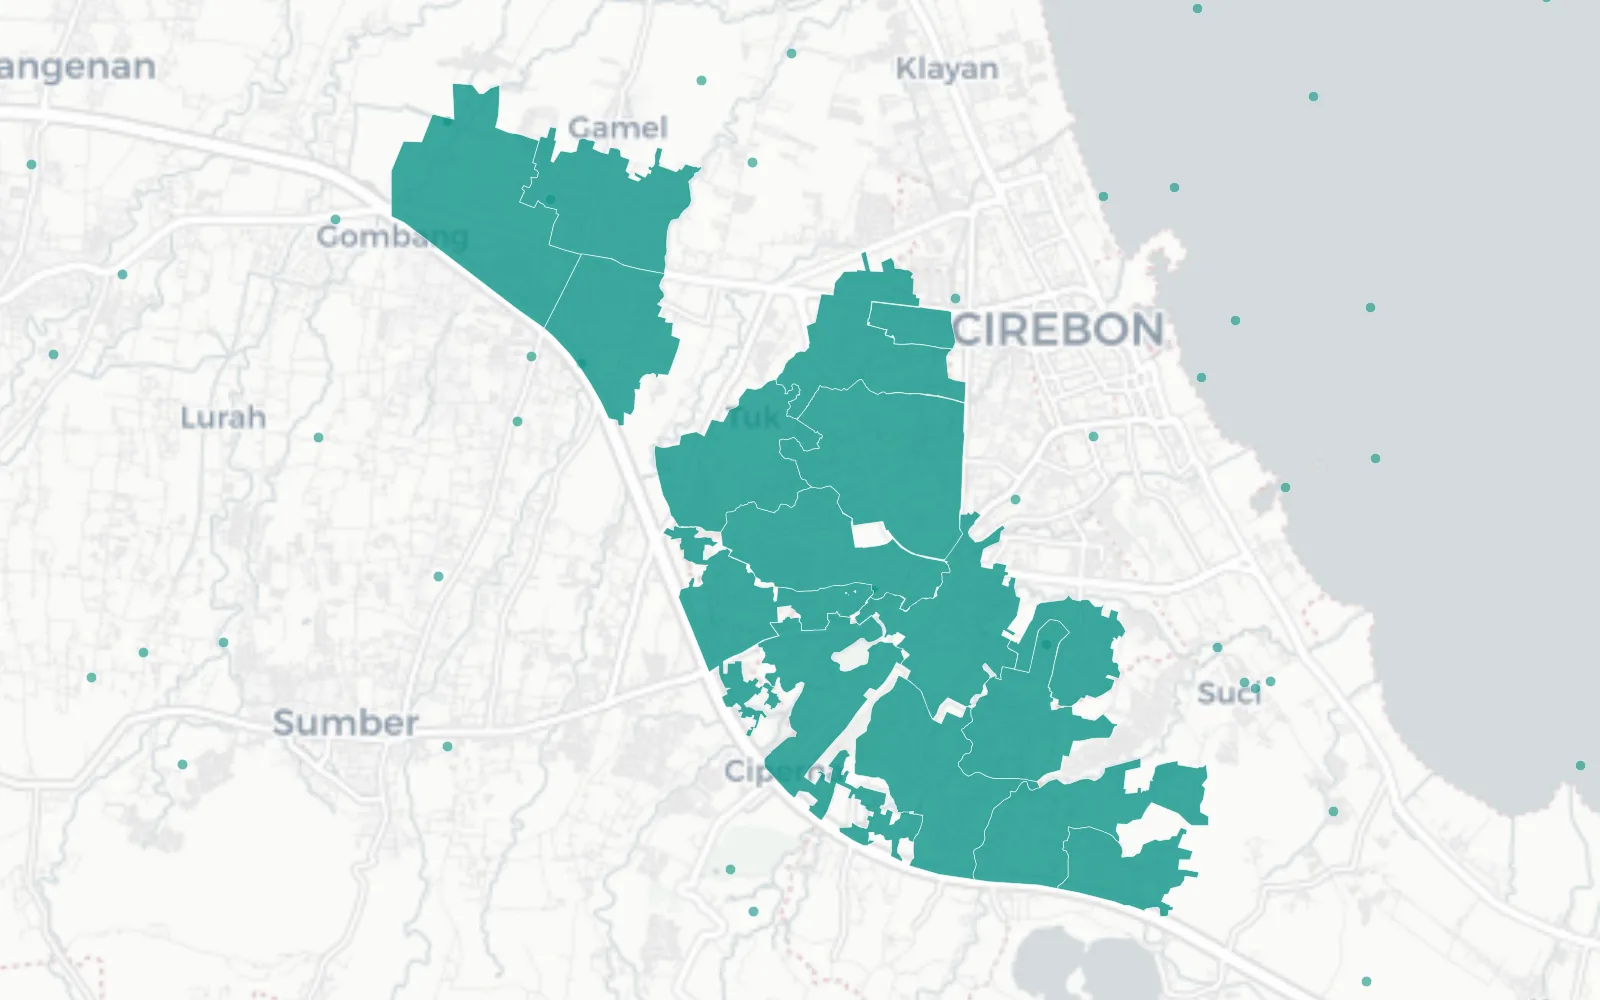
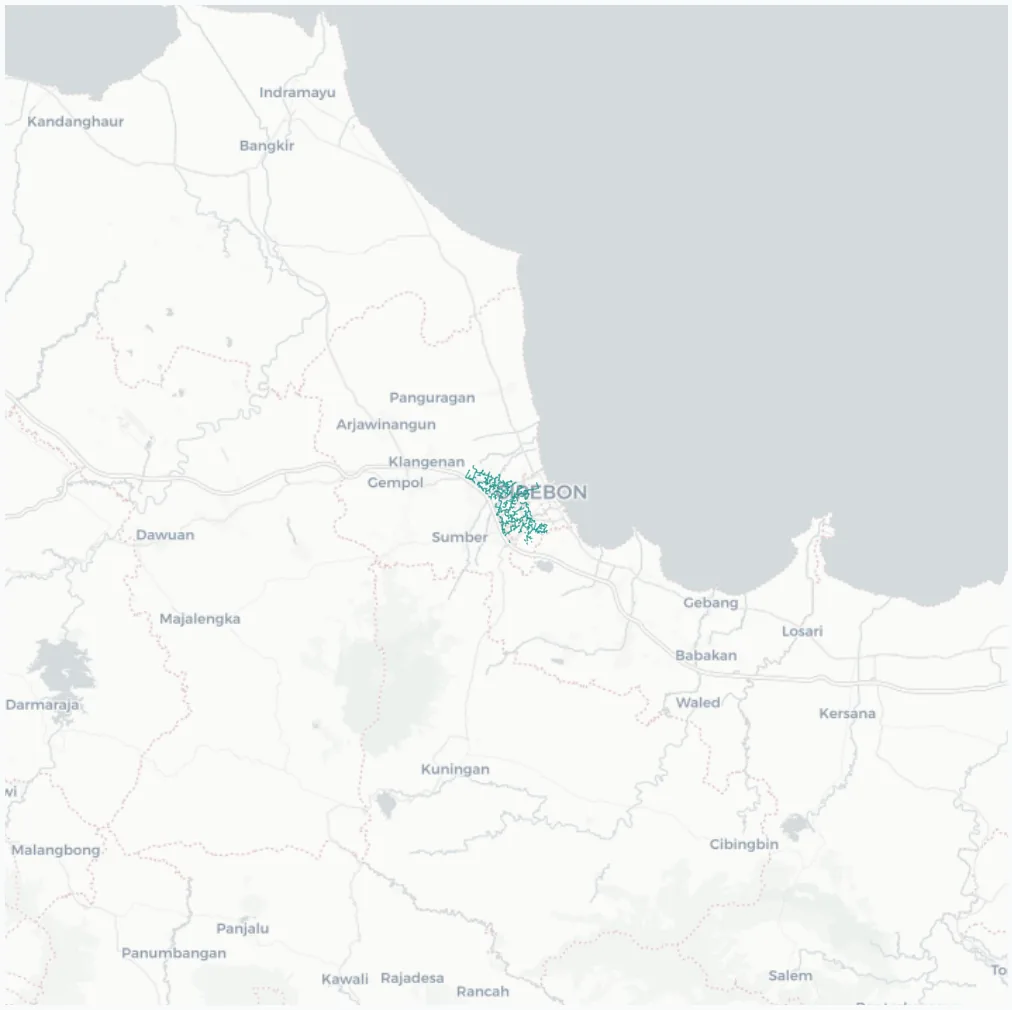
An end to end automated design capability that generated field ready fiber network plans, from feeder cable routing and last mile dropwire assignment through to equipment placement and bill of materials output, handling real world constraints like multi lane roads and highway crossings along the actual road network.
Generated 63,000+ dropwire segments and 3,000+ distribution cable runs in a single Cirebon production run, cutting fiber network design cycle time from weeks to hours.
Routing Engine
Smart Routing Engine
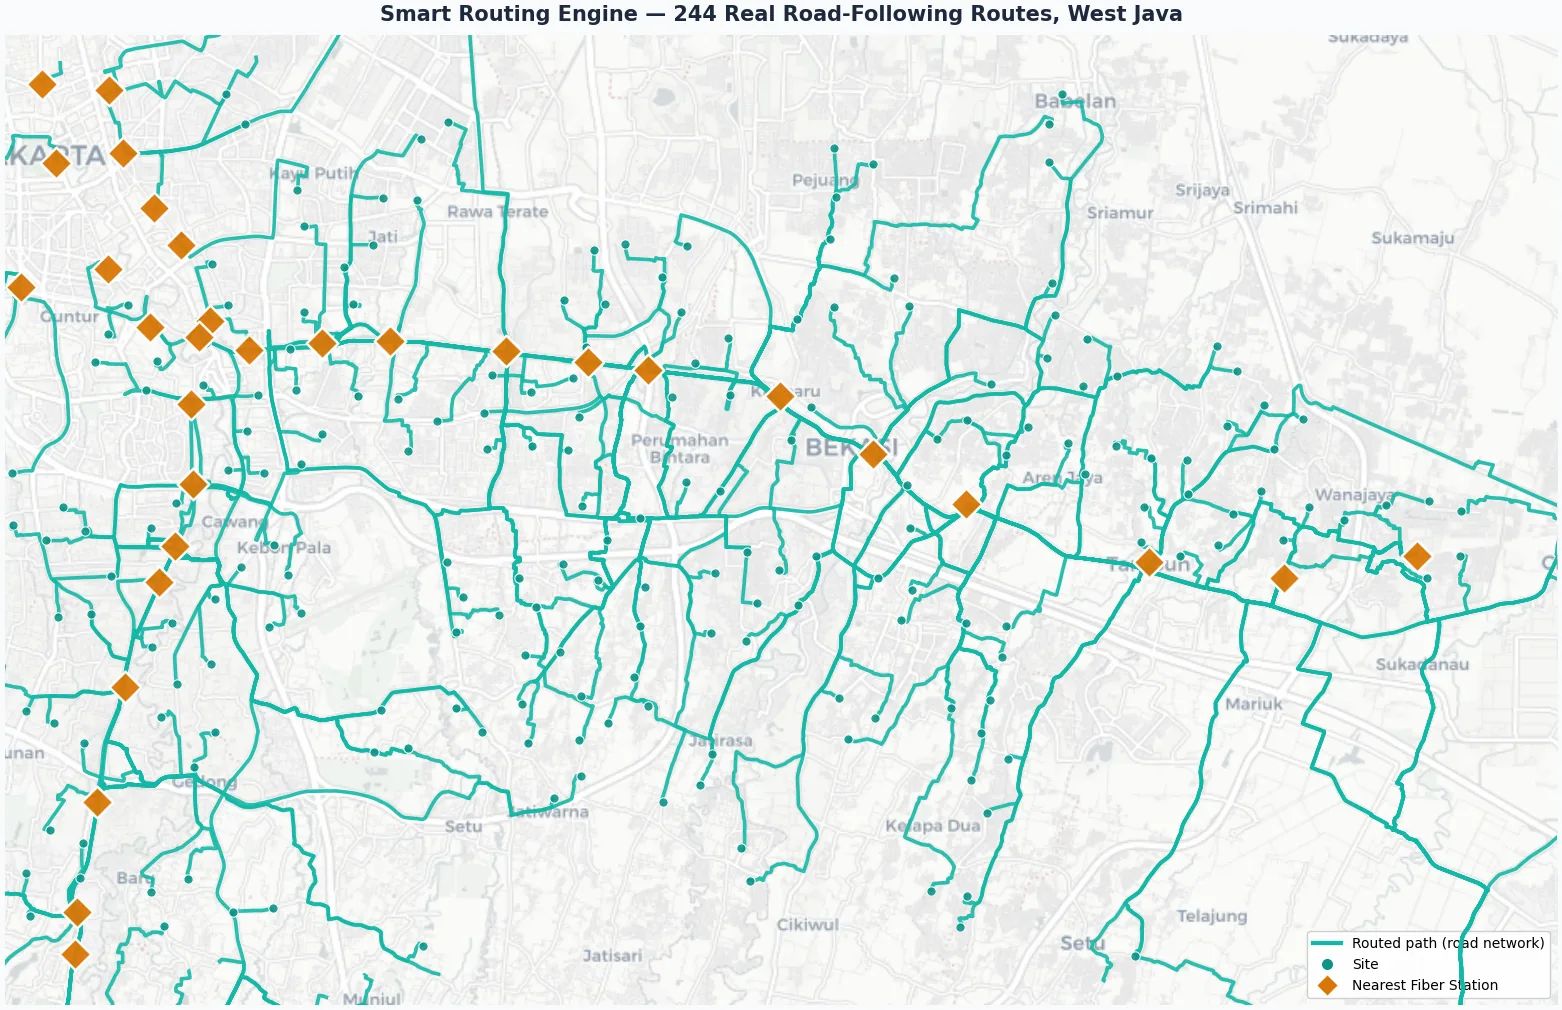
A custom routing engine tuned to Indonesia's actual road network, local road conditions, and routing behavior that generic routing APIs get wrong, purpose built for backbone route modeling and last mile site analysis.
Improved routing efficiency by 34% compared with generic routing approaches, strengthened fiber backbone distance estimation, and automated nearest fiber calculations for more than 28,000 sites. Its adaptable design also supports application across other industries with specialized routing, distance estimation, and location planning needs.
See the full case study
- The problem
- General purpose routing engines don't reflect how Indonesia's road network actually behaves, which threw off distance estimates used for fiber backbone and last mile planning.
- The method
- Built a custom routing engine tuned to Indonesia's road network, then routed every candidate site to its nearest fiber station instead of relying on straight line distance.
- The result
- 34% more efficient routing than generic approaches, with automated nearest fiber calculations across 28,000+ sites, 797 road following routes computed in a single assessment run.
Machine Learning
Commercial Building Classification Model
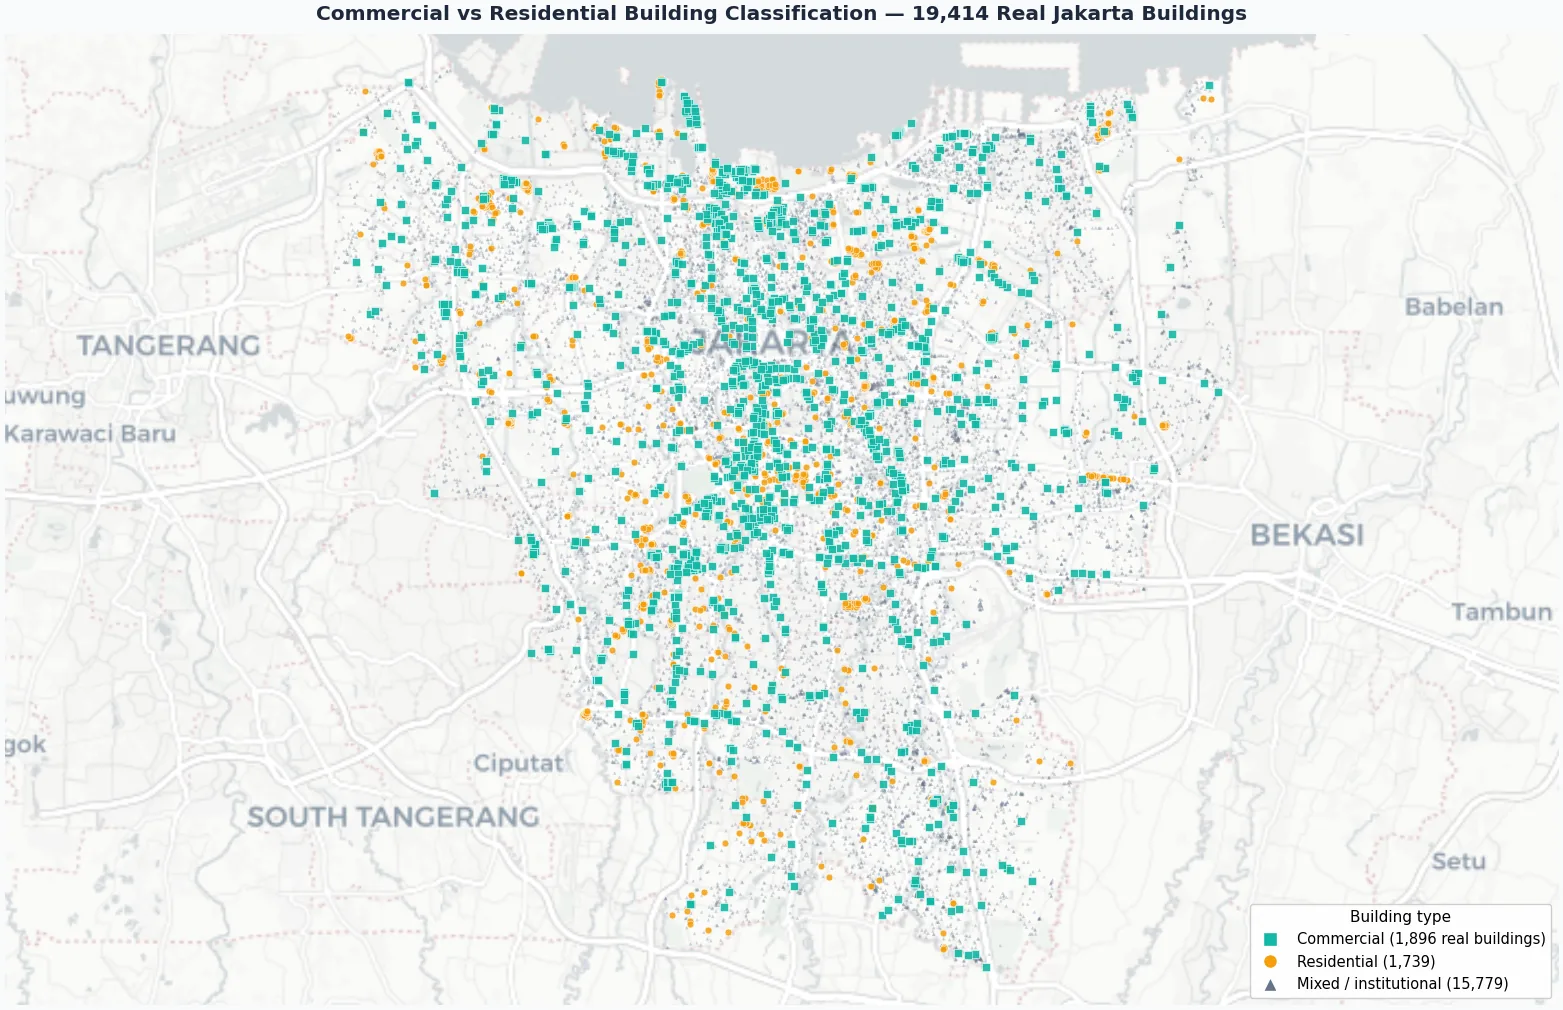
A classification model that distinguished commercial buildings from residential properties at scale, using neighborhood patterns, building characteristics, road access, and demographic indicators to catch enterprise targets otherwise indistinguishable from surrounding residential structures.
Tagged 19,000+ buildings across a Jakarta pilot alone, giving B2B fiber sales a qualified shortlist of high value commercial prospects instead of a raw, undifferentiated building list.
Regulatory GIS
Regulatory Spatial Analysis
A regulatory spatial analysis initiative that integrated provincial land use zoning laws with telecom infrastructure planning across Banten and West Java, screening every proposed tower and fiber route against legal deployment zones before it reached the field team.
Flagged permitted, restricted, and prohibited zones before capital was committed, avoiding costly permit rejections and rework across two of Indonesia's most tightly regulated provinces.
Competitive Intel
Competitor Tower Revenue Model
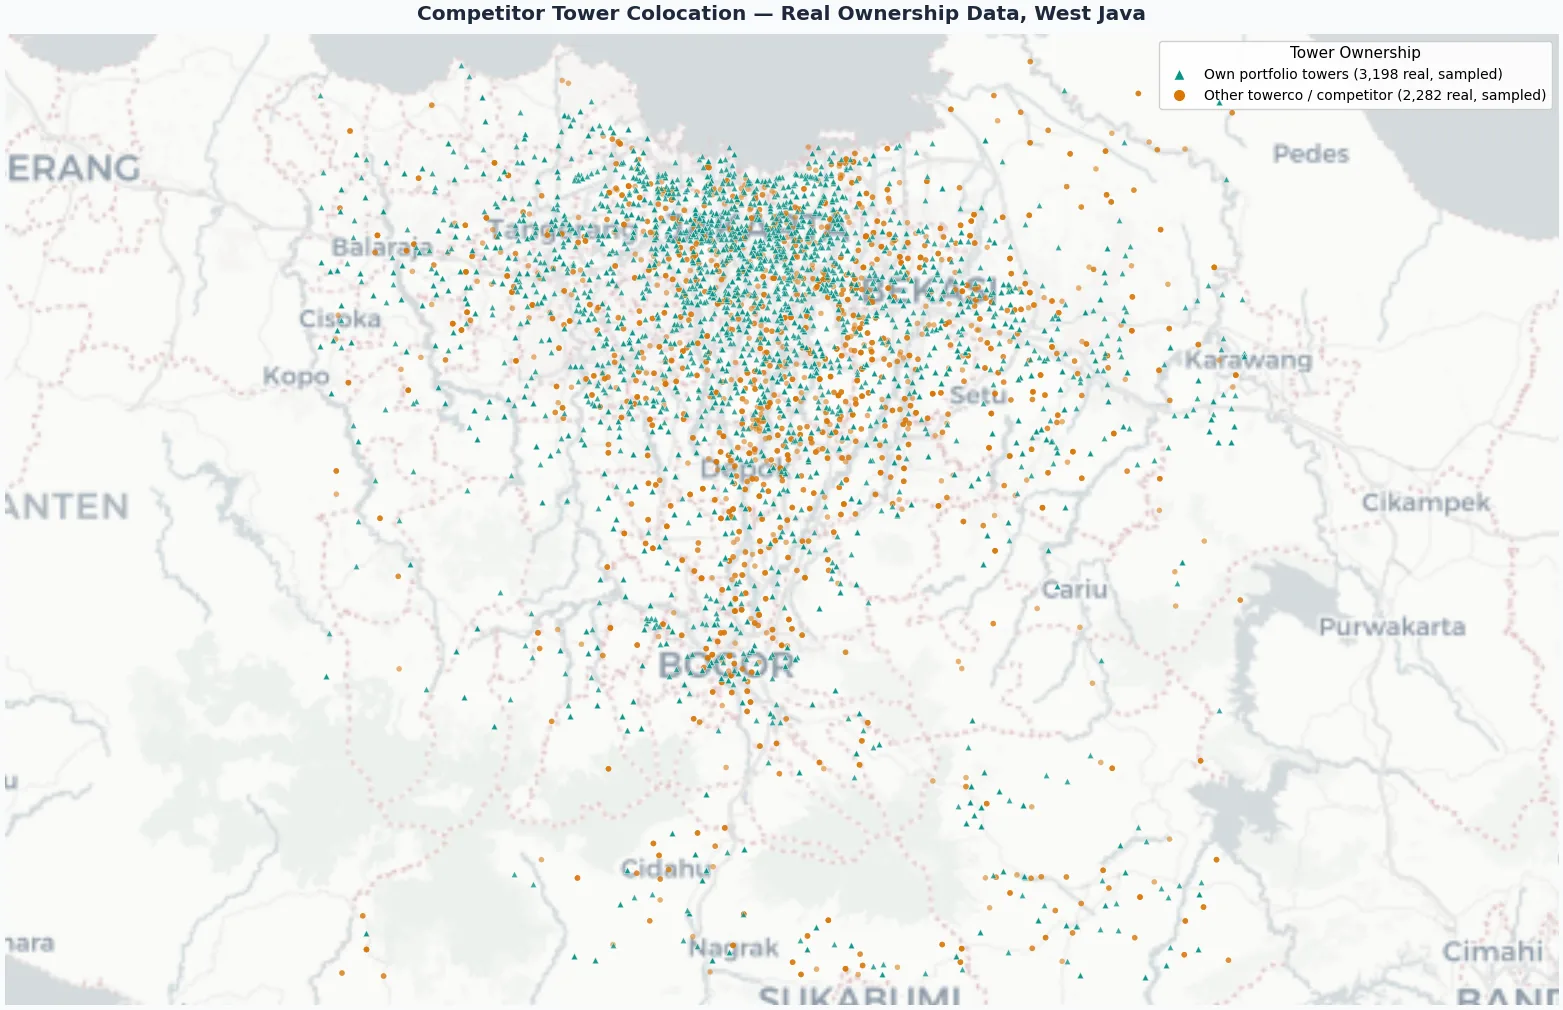
A systematic competitive intelligence exercise that mapped surrounding competitor tower locations, evaluated colocation viability across 3,146 sites, and modeled revenue potential based on proximity to existing infrastructure. Eight analysis iterations refined the methodology into a repeatable revenue quadrant scoring model.
Scored 5,480 tower records by ownership and revenue quadrant, directly informing which competitor towers to pursue for colocation and which sites justified a new build instead.
Market Strategy
Multi Operator Market Assessment
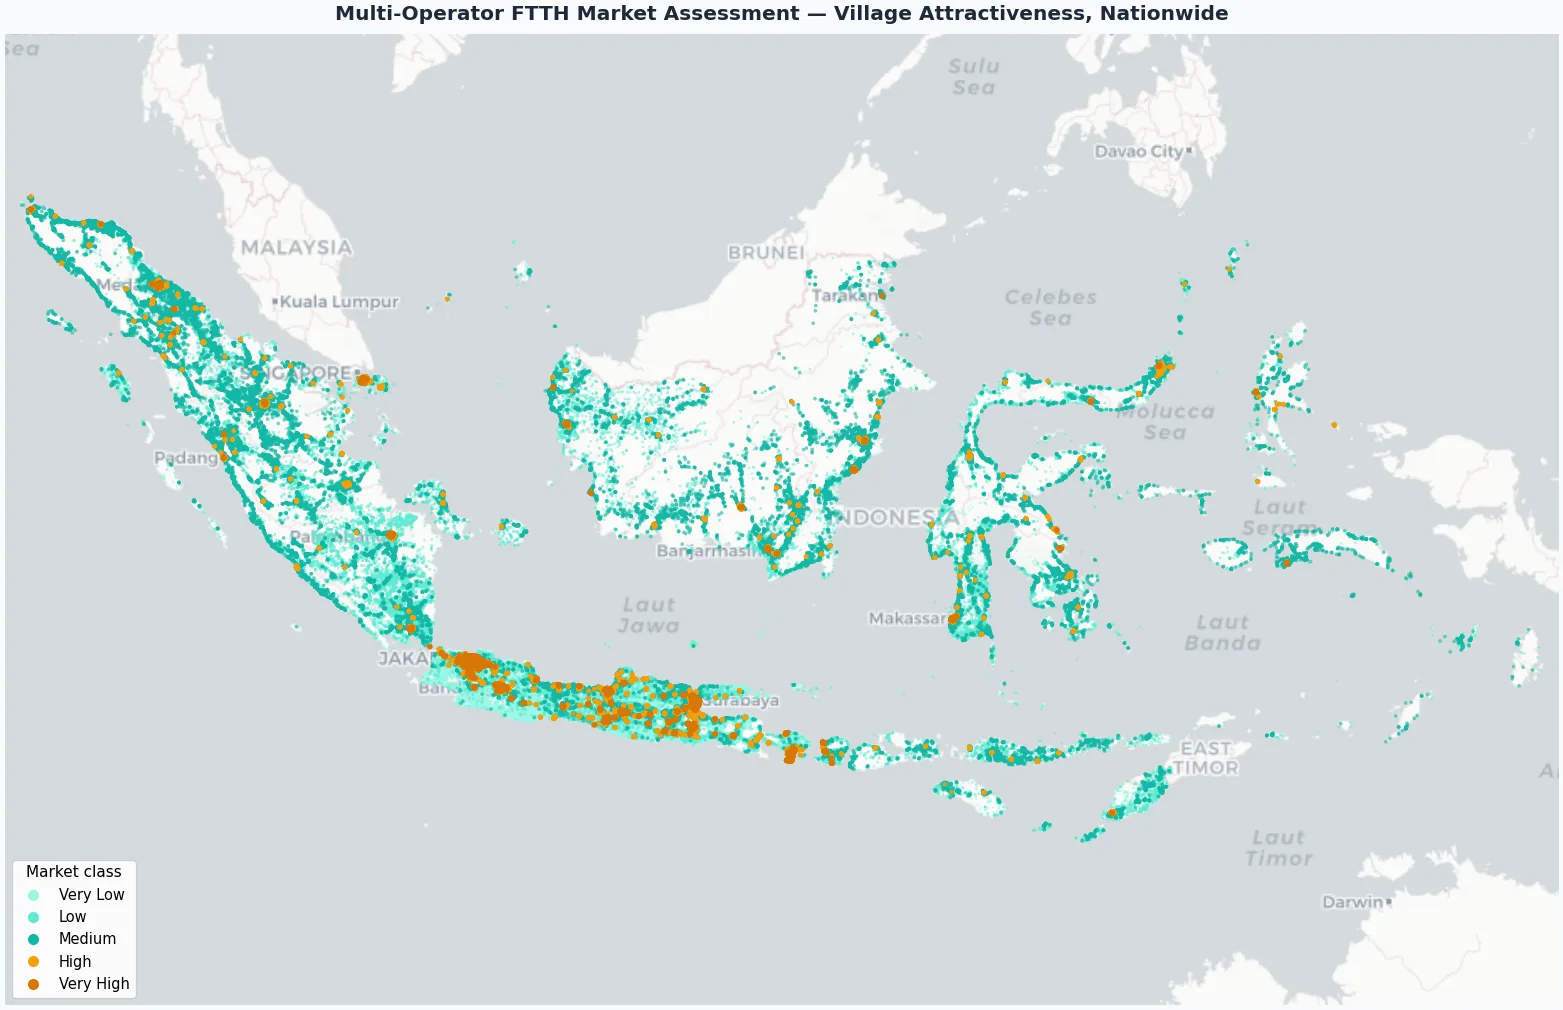
A market attractiveness model that scored FTTH opportunity at village level nationwide, weighing demand, competition, and service conditions in areas where several operators overlap, rather than mapping a single network in isolation.
Classified more than two million grids that cover Indonesia into clear market tiers, revealing where FTTH opportunity is strongest and where competition has already closed the window.
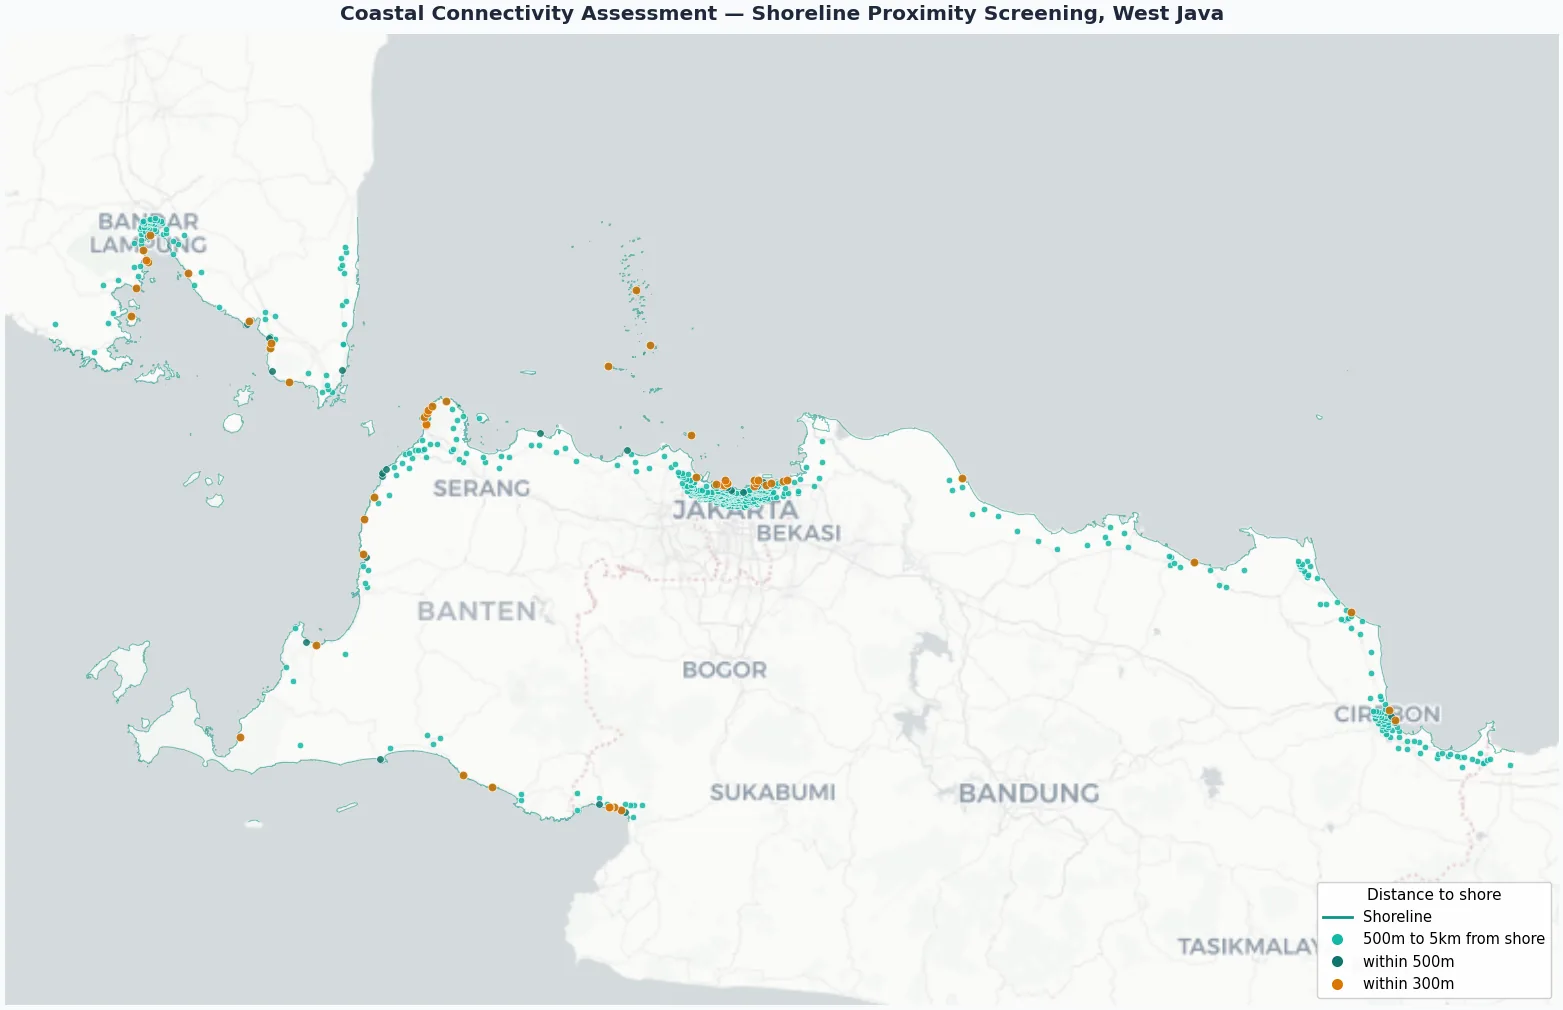
Coastal Siting
Coastal Connectivity Assessment
A specialized siting screen for coastal connectivity, where shoreline geometry, distance to shore, and line of sight decide whether a site is viable at all before anything else gets evaluated.
Graded candidate sites along the coastline into clear distance to shore bands, narrowing a difficult, terrain specific search down to only the sites that survived every screen.
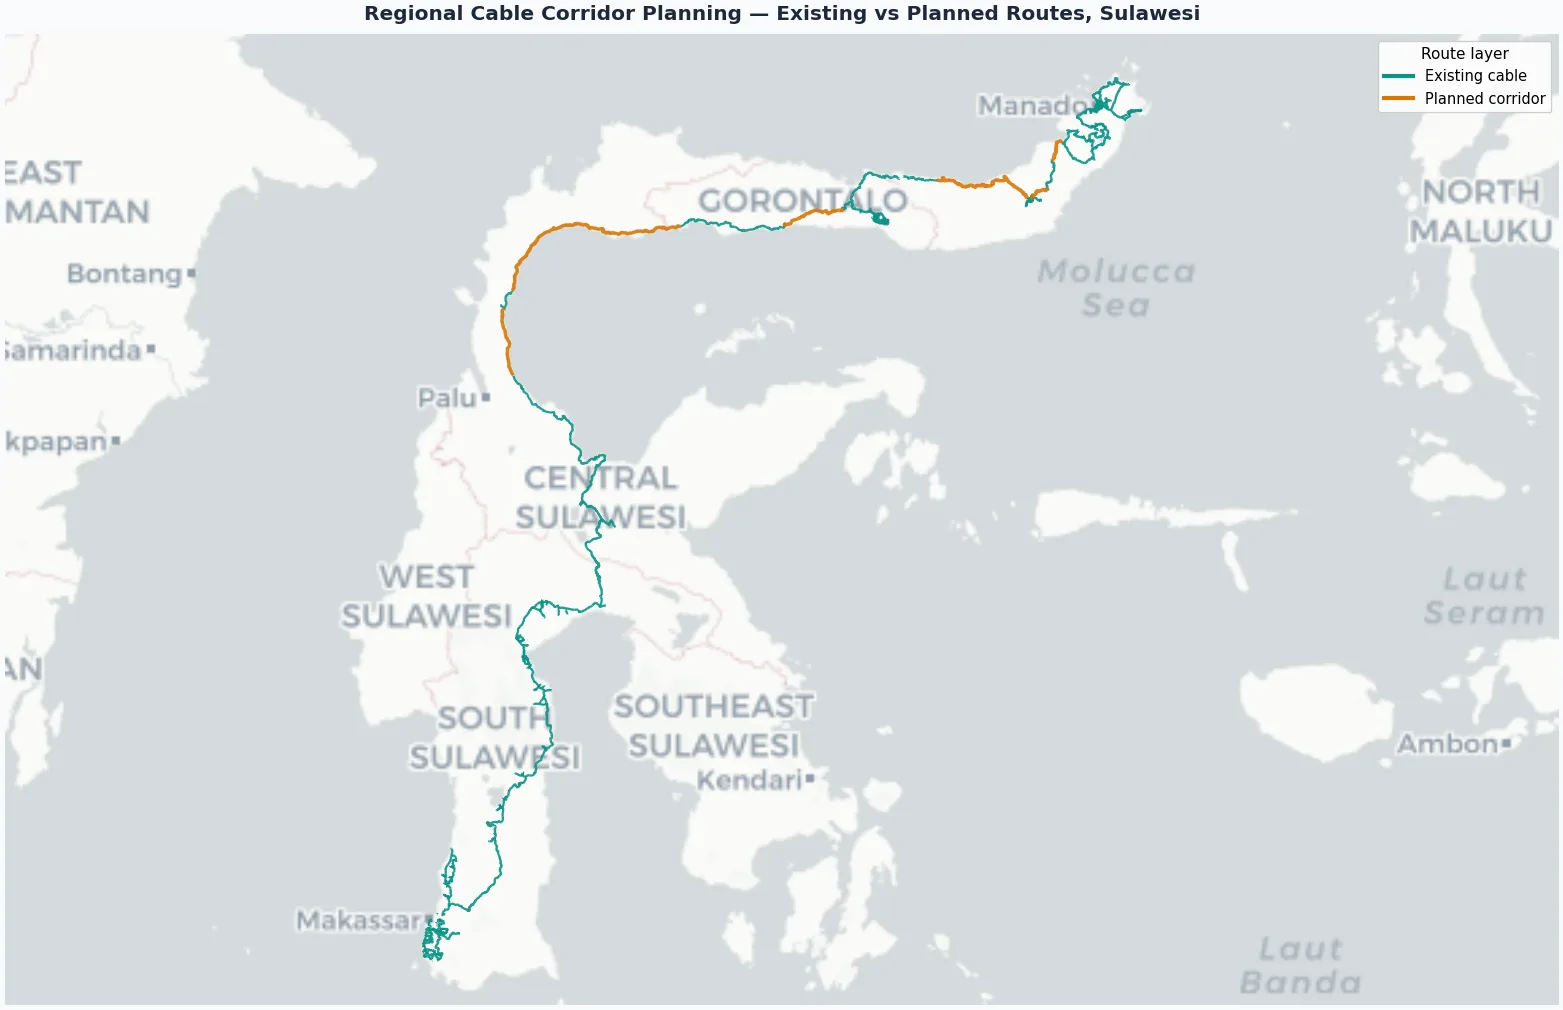
Backbone Planning
Regional Cable Routes Planning
A regional backbone planning exercise that traced and extended fiber cable routes across Sulawesi, using existing corridors as the base layer that new route selection had to build from rather than duplicate.
Aligned 1,197 existing route segments (~3,036 km) with 7 planned segments (~538 km) into a single regional view, showing planners exactly where new routes extend the network and where they would have doubled up on it.
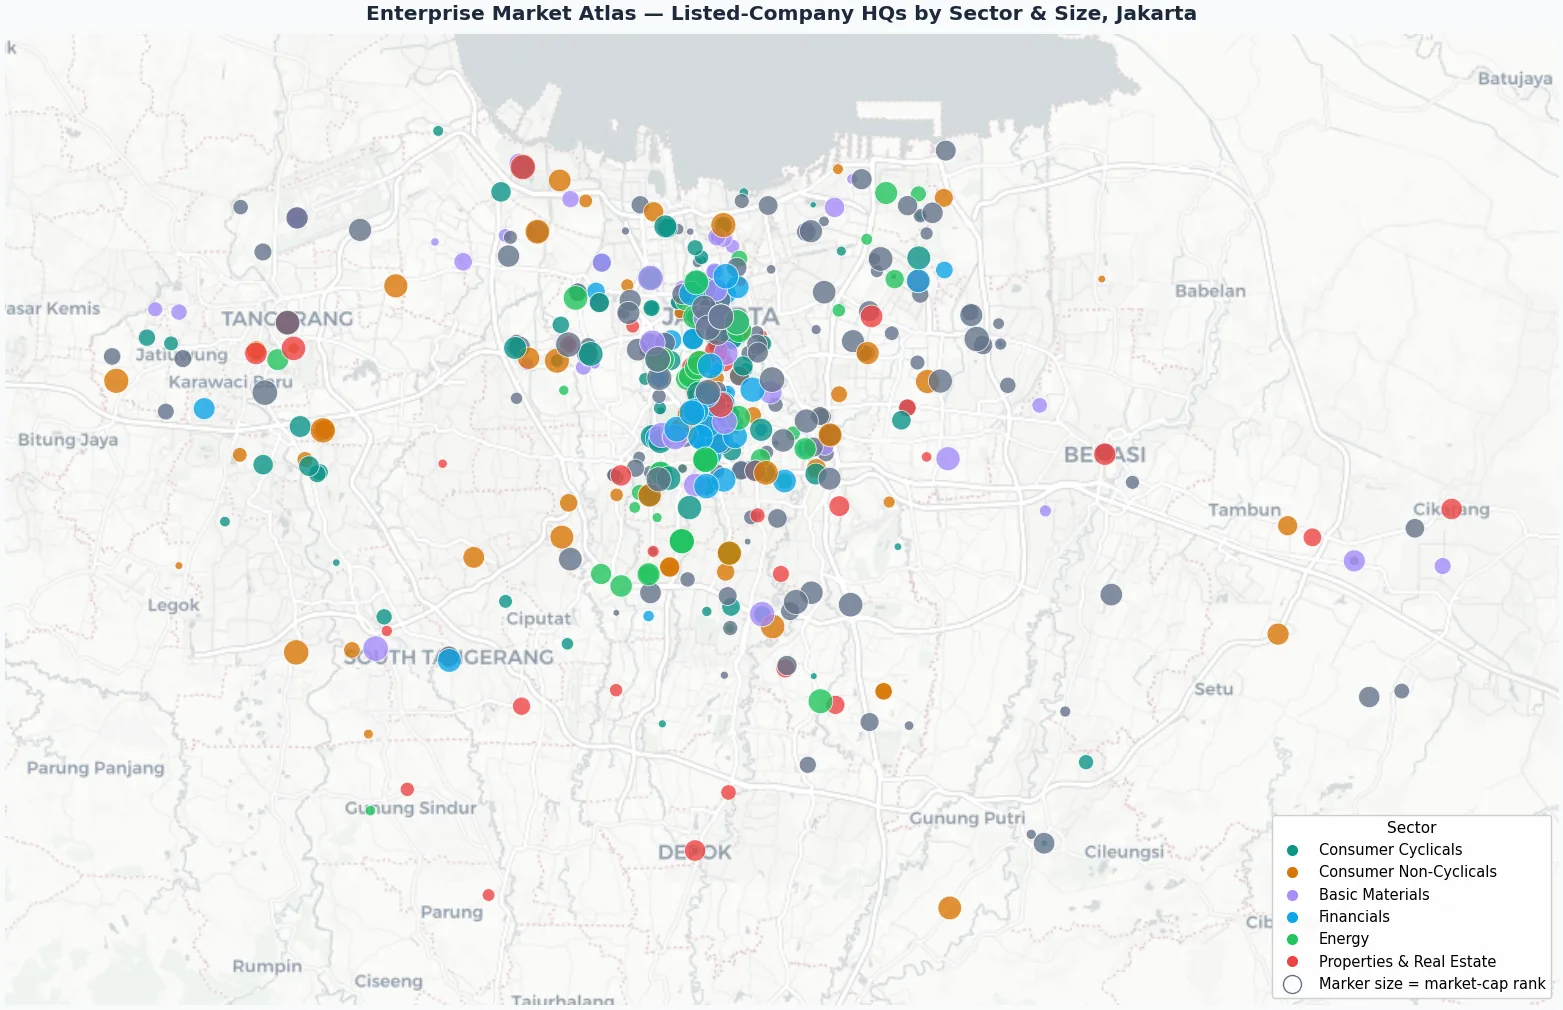
Enterprise B2B
Enterprise Market Atlas
A corporate targeting layer built from public listed company data, headquarters location, sector, and market scale, turning financial market data into a spatial view of enterprise demand by sectors.
Plotted listed companies across Greater Jakarta, giving enterprise sales a spatial shortlist of exactly where the highest value B2B accounts physically cluster.
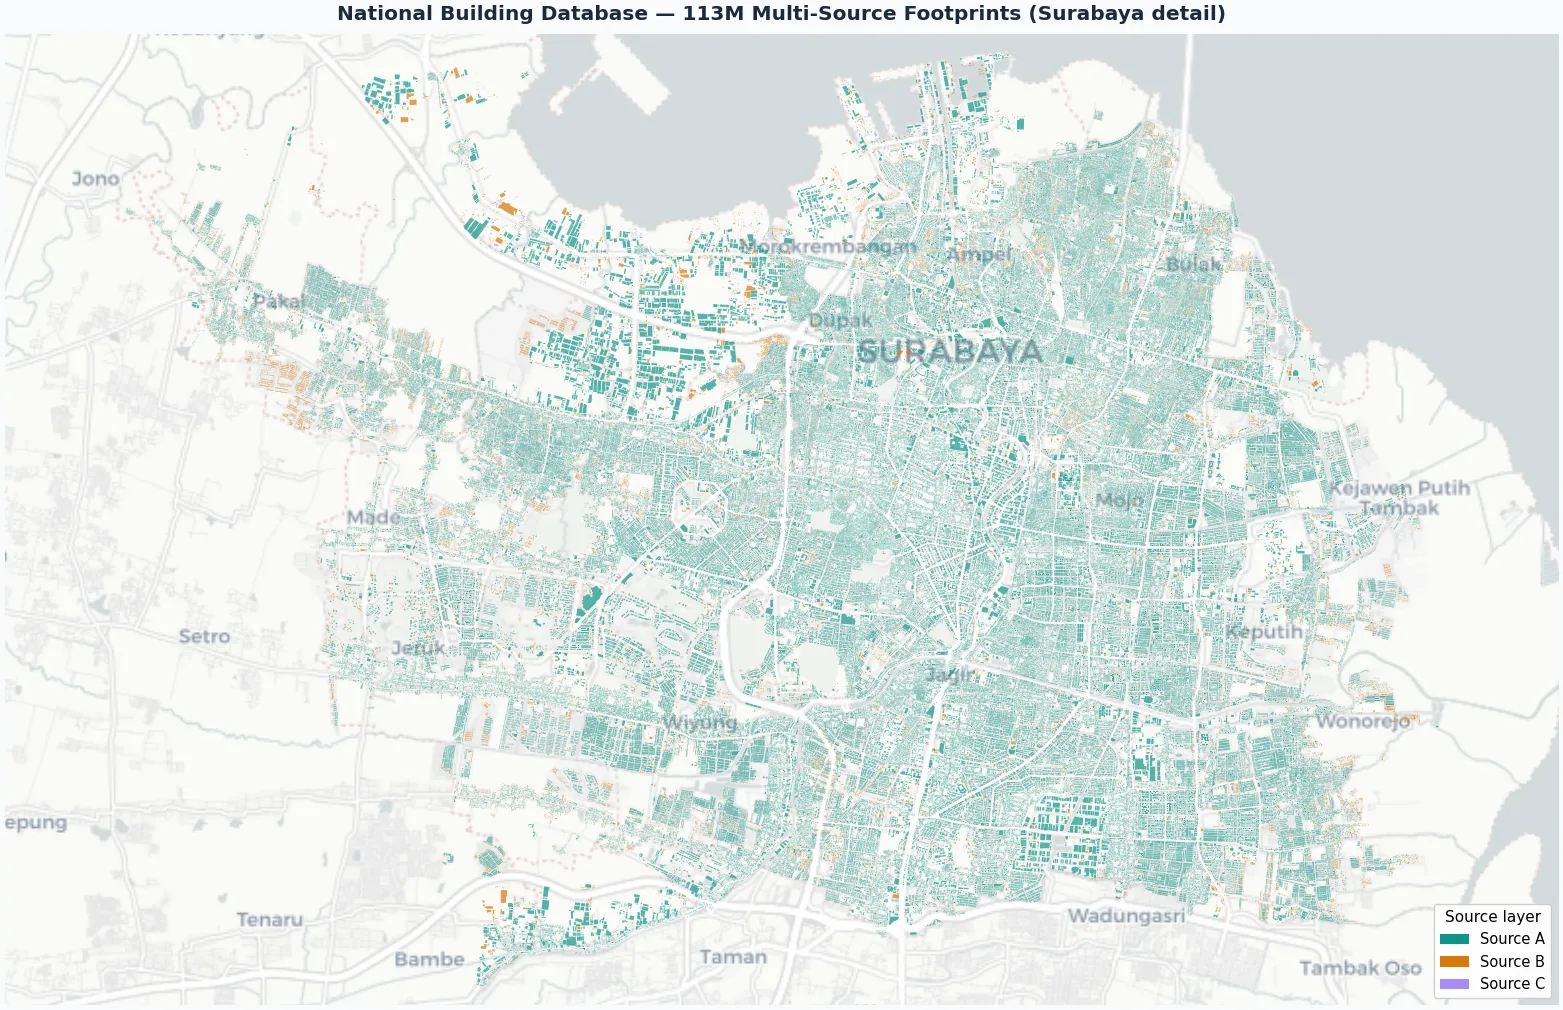
Data Production
National Building Database
A national building footprint layer built by reconciling overlapping and conflicting building outlines from multiple independent sources into one consistent, deduplicated dataset, footprint by footprint, across the whole country.
Consolidated 113 million+ building footprints as a shared reference layer by multiple downstream analyses such as demand, market, and site analysis on this list depends on.
Computer Vision
Road Network Extraction
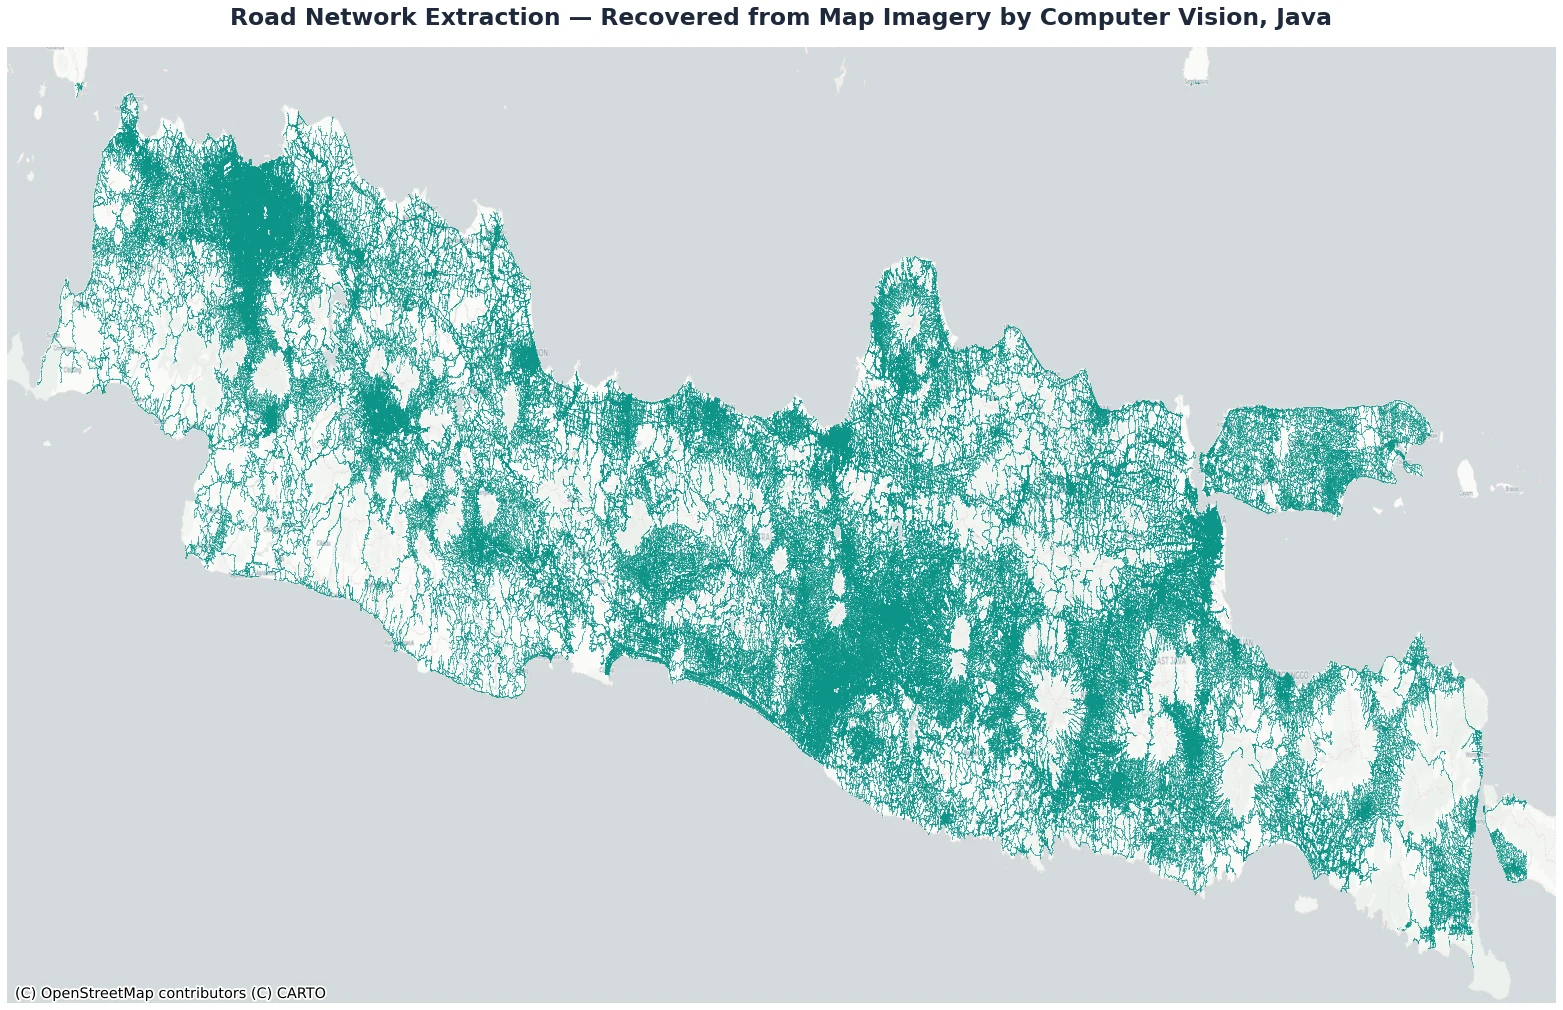
A computer vision pipeline that detected road coverage directly in map imagery, thinned it to centerlines, and traced those into clean vector geometry at scale. reduced the amount of manual map digitization required to produce a structured road-network layer.
Extracted 22 million+ road coverage points into a usable national road network, turning raw map imagery into structured geospatial data without manual digitizing.
Network Data
Network Quality Grid
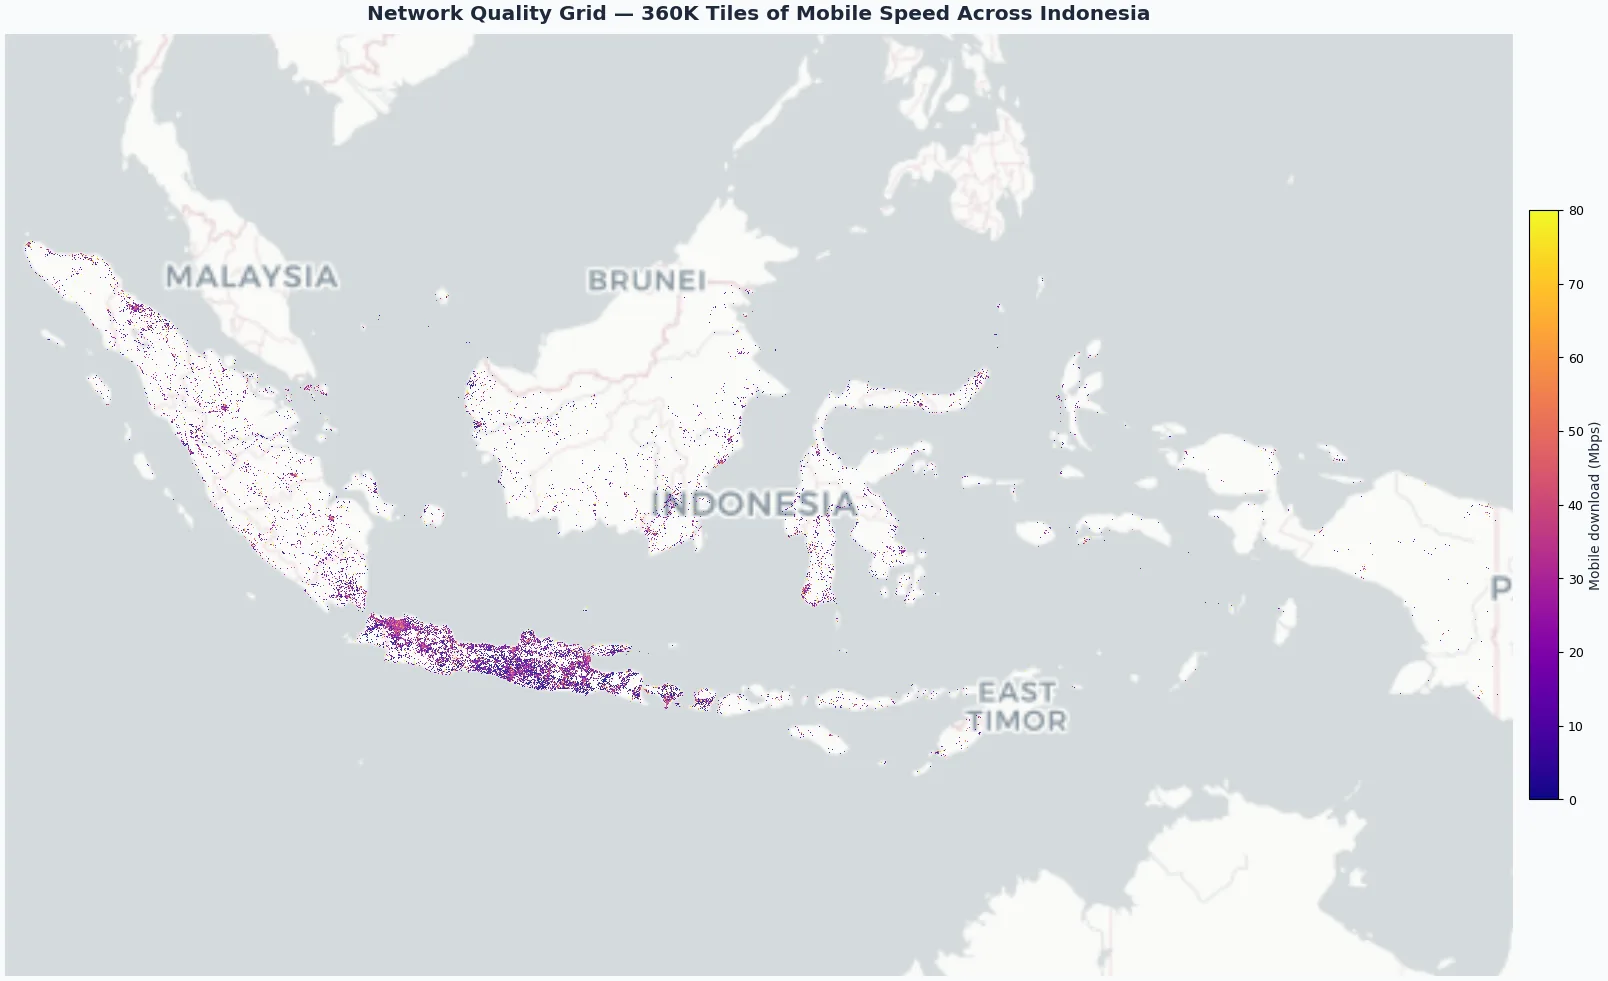
A network quality surface built from open crowdsourced speed measurements, normalizing mobile download, upload, and latency per tile so technical conditions could be compared like for like across regions instead of relying on self reported coverage claims.
Turned scattered open measurements into a single comparable national grid of 360,000+ tiles (median 17 Mbps mobile download), a reusable layer for coverage, market, and service gap analysis.
Market Data
Buying Index Grid
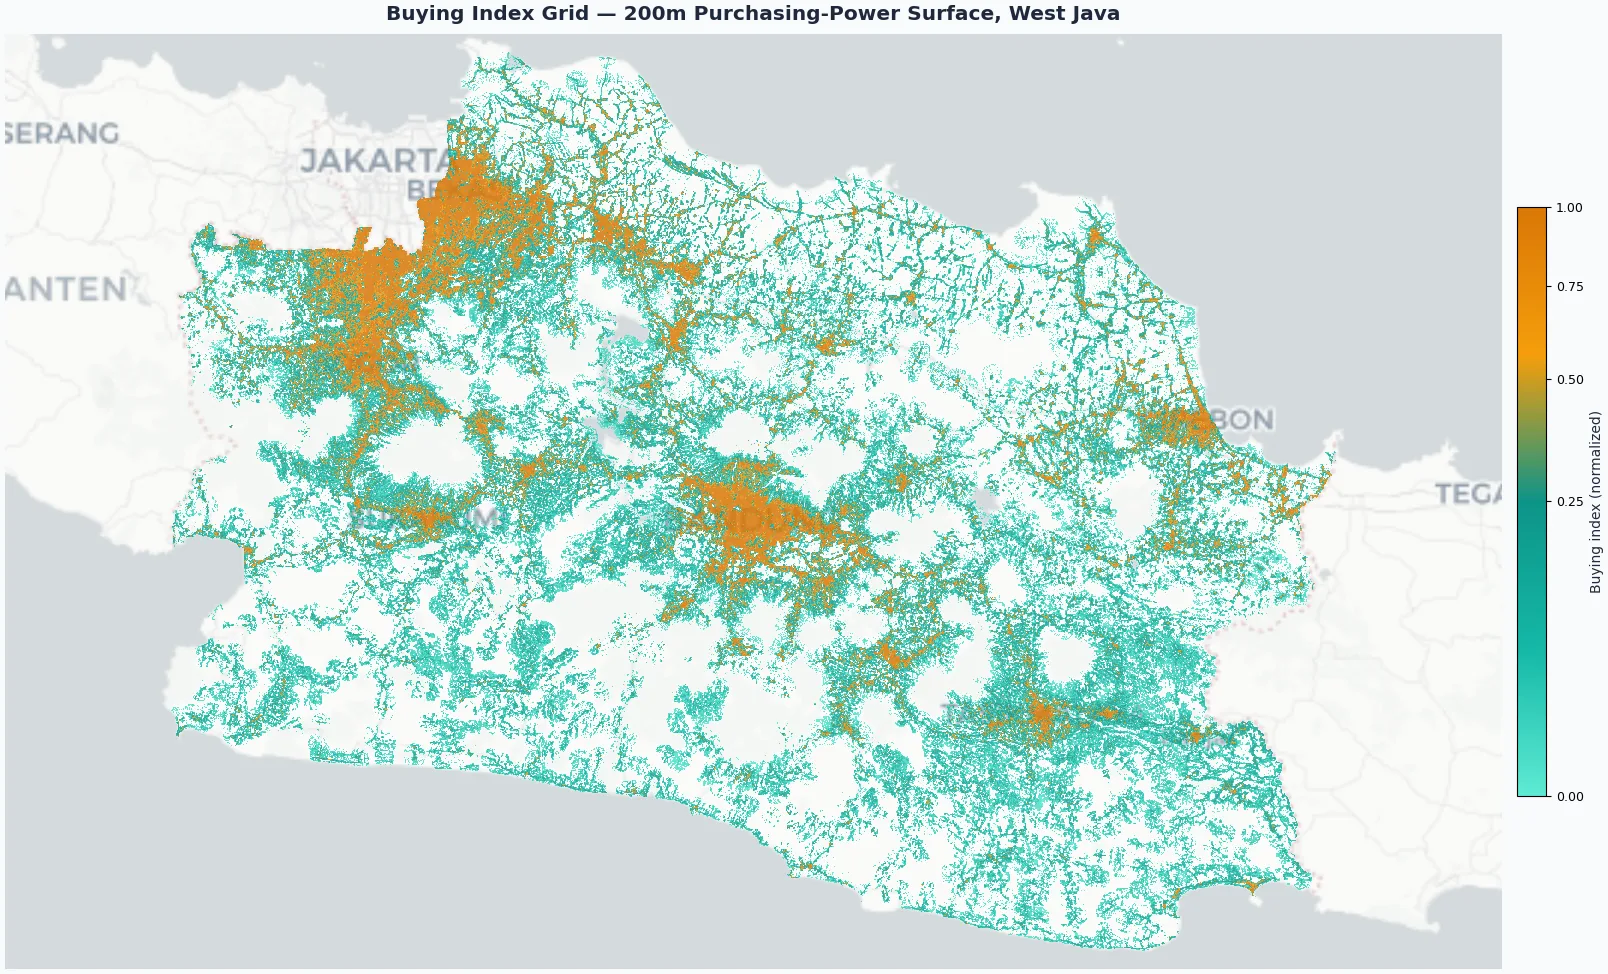
A fine grained purchasing power surface that resolves demand affinity to a 200 meter grid nationwide rather than broad administrative averages, combining and normalizing demographic and buying signals so commercial attractiveness could be read close to street level in every province representing socio economic conditions.
Covered 41 million+ 200 meter grid cells across 34 provinces and 488 kabupaten and kota, exposing high value buying pockets that district level averages quietly hide.
Predictive Analytics
Site Profiling by Surrounding Objects
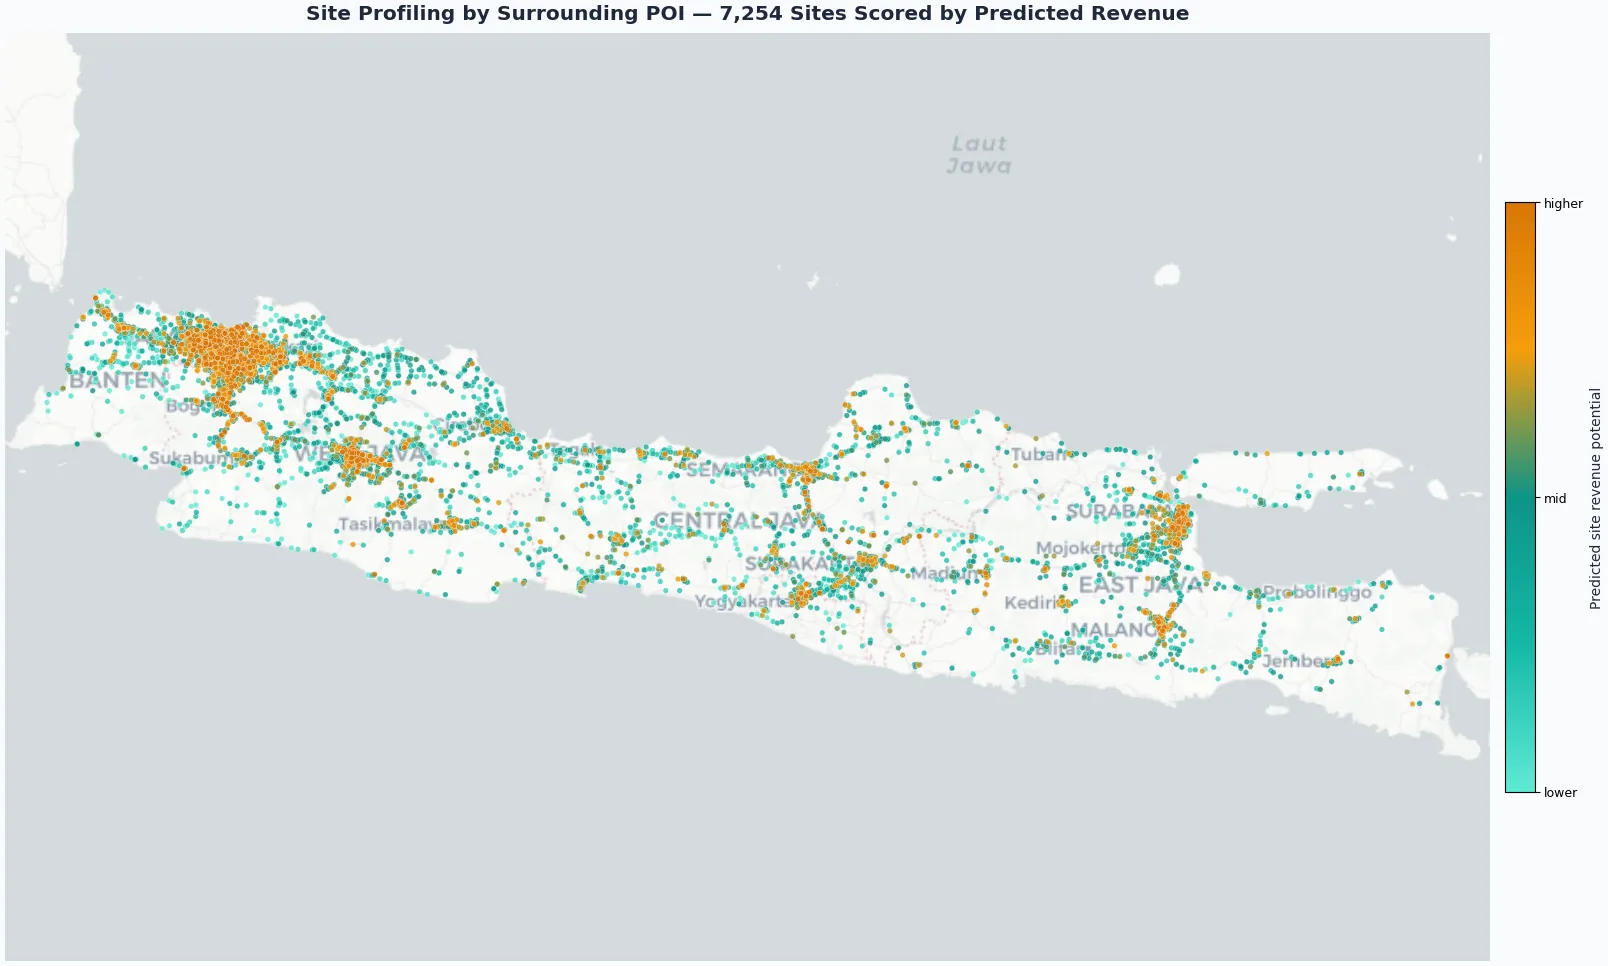
A gradient boosted regression model that learns which mix of surrounding businesses and amenities tends to predict strong site performance, then applies that pattern to grade new candidates before a single site visit happens.
Ranked 7,254 candidate sites across Java by predicted revenue potential, replacing a judgment call with a shortlist any team could act on immediately.
Applied AI
Private AI Assistant
A private LLM chat with local knowledge that I built and deployed on internal infrastructure, self hosted model, swappable model picker instead of committing to a single vendor's model.
Put a private AI assistant with local knowledge for internal teams designed to keep model inference and conversation data within internal infrastructure, keeping every conversation on premises instead of routing through a third party API.